Environmental Engineering Reference
In-Depth Information
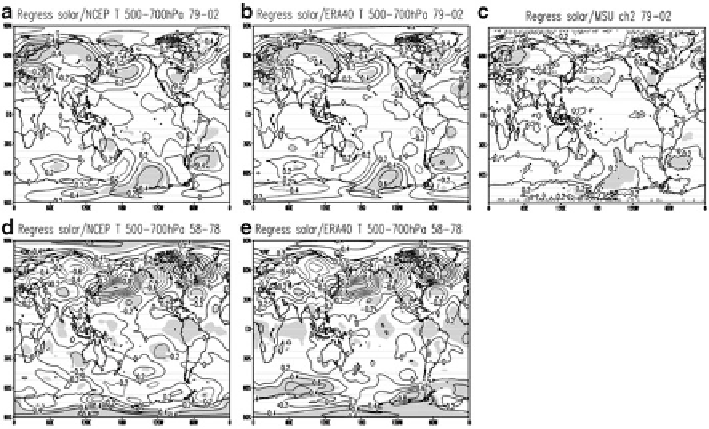
Fig. 4.4
Same as Fig.
4.3
except for the troposphere (500-700 hpa) (Adapted from Powell and Xu
(
2011
), Figure 9)
in 1979-2002 over most areas (Fig.
4.4a
vs. d and Fig.
4.4b
vs. e). However, there is
a significant wavelike pattern over the tropospheric northern middle latitudes.
To summarize, the regression analyses indicate the temperature responds to the
solar variation in the stratosphere and troposphere quite differently. The anomaly is
a reversal with the solar variation and can be identified over most areas in the two
periods. However, the regression analysis cannot significantly reproduce the oppo-
site solar signal in the troposphere; this result implies that solar variability is closely
related to lower stratospheric temperature, but it only partially explains the temper-
ature anomaly in the troposphere.
4.4.2 ENSO, QBO, and Stratospheric Aerosol Response
Given the solar forcing results, what other forcings could be responsible for the
temperature anomalies? To address this question, the remaining, limited set of
climate forcing terms in Eq. (
4.1
) were analyzed, and the ERA-40 dataset will
only be used in this section.
The regression for the temperature variability for the three additional separate
climate forcing terms (ENSO, QBO, and stratospheric aerosols) was completed.
The results in the stratosphere are shown in Fig.
4.5
. First, there is a zonally
heterogeneous response to the ENSO forcing over the globe, and the pattern is
quite different in the two periods (Fig.
4.5a, b
) except both show negative responses
observed in tropical eastern Pacific. In addition, an interesting result worth noting is
that the ENSO forcing is symmetrical about the equator over most of the tropical/
subtropical areas although the amplitude response is different in the two periods.
Search WWH ::

Custom Search