Environmental Engineering Reference
In-Depth Information
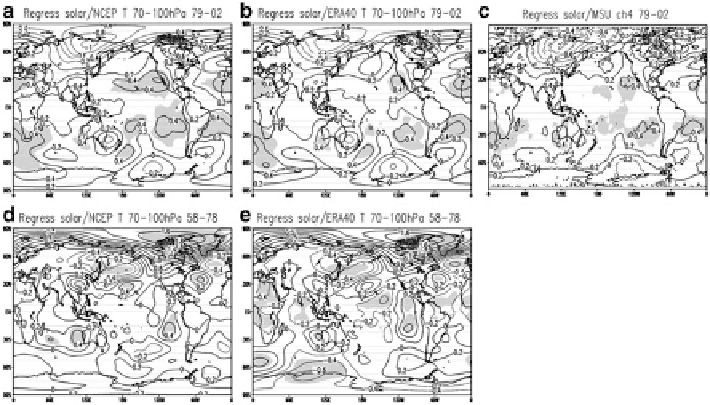
Fig. 4.3
Solar signal in the stratospheric (70-100 hpa) temperature anomalies (
C) from regres-
sion analysis of 1979-2002 (
upper
) and 1958-1978 (
bottom
): (
a
,
d
) NCEP/NCAR reanalysis,
(
b
,
e
) ERA-40 reanalysis, and (
c
) MSU ch4 measurement. The
shaded areas
indicate the statistical
significance at the 95% level (Adapted from Powell and Xu (
2011
), Figure 8)
4.4.1 Solar Response
For the stratosphere, the multiple linear regression analysis of temperature with the
normalized 10.7-cm solar flux in 1979-2002 shows (Fig.
4.3a-c
) a strong negative
regression coefficient (cooling) in the Arctic zone with positive values (warming) in
the tropical latitudes and a portion of the southern middle-high latitudes in the two
reanalyses and MSU ch4 measurements. In contrast, the regressed temperature
anomaly in 1958-1978 (Fig.
4.3d, e
) has a large positive regression coefficient in
the Arctic zone and negative value in the tropical latitudes. The strongest correlations
occur over part of the Arctic zone and the Pacific. In these areas, the correlations
exceed the statistical significance test at the 95% level. The opposite sign of the
temperature response to solar variation in the two periods has been significantly
reproduced in most areas, especially for the strong signal in the Arctic zone.
For the troposphere, the regression analysis for 1979-2002 shows a similar
pattern in each of the three datasets except for the Antarctic zone (Fig.
4.4a-c
).
Negative regression coefficients tend to occur over the high latitudes (50-80
N),
while positive values occur over the middle latitudes (20-50
N). The wavelike
pattern alternating between positive and negative anomalies appears over both
northern and southern middle latitudes. However, a large difference is found over
the Antarctic zone in the three datasets. The MSU and NCEP data show weak
positive anomalies, while the ERA-40 shows moderate negative anomalies over the
eastern hemisphere of the Antarctic polar region. In 1958-1978, the temperature
regression analysis corresponding with solar variability is similar to its counterpart
Search WWH ::

Custom Search