Environmental Engineering Reference
In-Depth Information
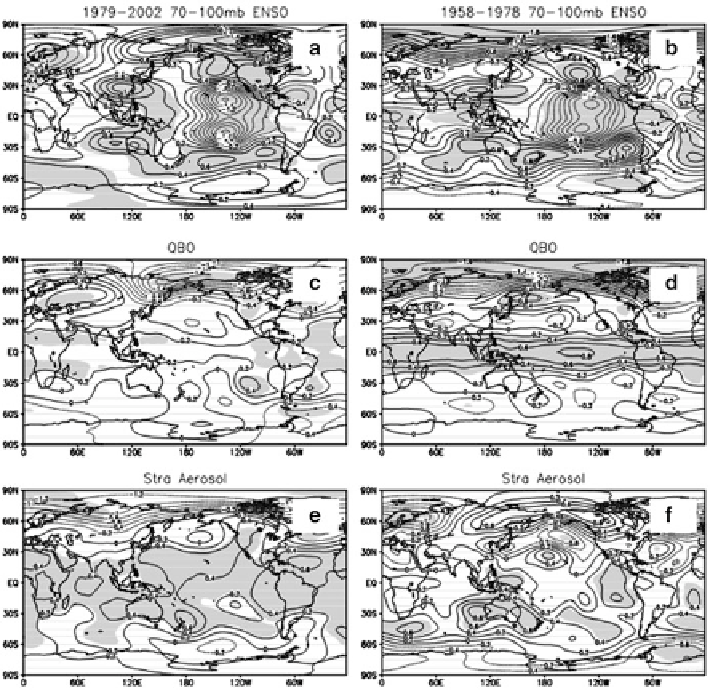
Fig. 4.5
Temperature response in the stratosphere (70-100 hpa) to the forcing in the two periods
of 1979-2002 and 1958-1978: (
a
,
b
) ENSO; (
c
,
d
) QBO; (
e
,
f
) stratospheric aerosol. The
shaded
areas
indicate the statistical significance at the 95% level
The shaded areas indicate that the temperature response to ENSO exceeds the
statistical significance test at the 95% confidence level.
Second, the stronger signal response to the QBO forcing appeared over the
tropical and Arctic zones. However, the amplitudes are different in the two periods
(Fig.
4.5c, d
). The result clearly reproduced the negative relationship between the
QBO forcing and stratospheric temperature over the Arctic (Holton and Tan
1980
)
where the Arctic stratosphere is indeed warmer under easterly QBO conditions and
colder under westerly QBO conditions. Moreover, a remarkable zonal homoge-
neous positive anomaly exceeding the 95% significance test is observed in the
tropical areas, especially in the period of 1958-1978.
Third, the response to the stratospheric aerosols (Fig.
4.5e, f
) has a similar
pattern in the two periods with positive contributions in the tropical and subtropical
areas. However, the response is significantly different over both polar regions in the
Search WWH ::

Custom Search