Chemistry Reference
In-Depth Information
8
HO
OH
H
N
7
I
O
O
HO
I
N
H
O
6
I
H
N
OH
OH
5
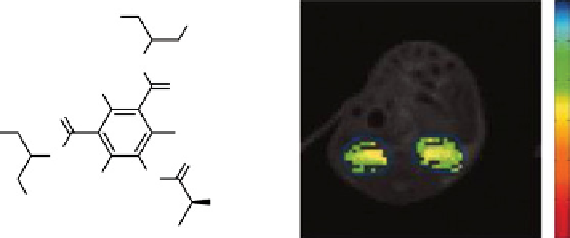
fIgurE 10.3
left: Chemical structure of Iopamidol showing exchangeable amide protons. Right: Corresponding pH map of a mouse
kidney obtained after applying ratiometric analysis to the saturation transfer effects from the amide proton pools at 4.2 ppm and 5.5 ppm.
Adapted with permission from Ref. [25].
O
H
*
O
OH
O
H
OH
O
O
O
H
*
O
H
O
O
O
H
O
H
O
O
O
H
H
O
O
H
O
H
MTRasym (1 ppm)
30%
20%
10%
0%
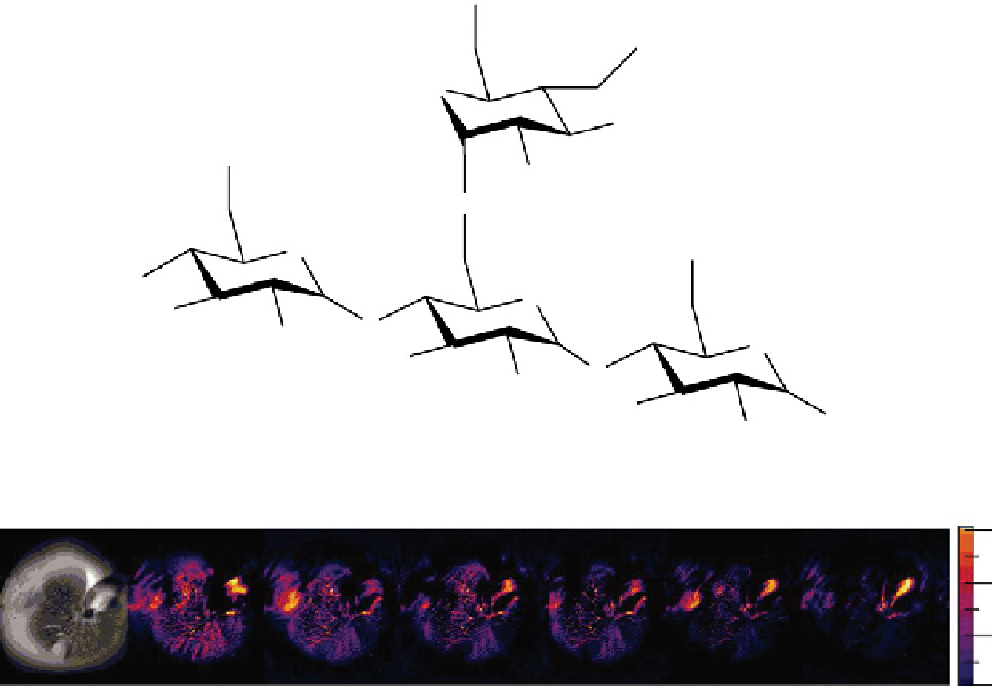
fIgurE 10.4
Top: Chemical structure of a fragment of glycogen showing exchangeable -OH protons. Bottom: GlycoCEST imaging
of a perfused fed-mouse liver at 4.7 T and 37°C. The colourised images show the gradual reduction in the CEST signal originating
from glycogen as a result of glucagon stimulation of glycogenolysis. Reproduced with permission from Ref. [26]. (
See insert for
colour representation of the figure.)
)
pre-diabetic individuals and obese subjects, noninvasive CEST imaging of liver and skeletal glycogen could be useful in
developing a better understanding of the pathophysiology of these diseases.
Another exciting example of
in vivo
CEST imaging of endogenous -OH protons was presented by ling et al. [27], who
obtained a map of glycosaminoglycan (GAG) distribution in the patella of a human knee using CEST imaging. CEST images
showed a clear delineation of a cartilage lesion on the medial facet of the knee in addition to a decrease in GAG concentration
on the medial side of the patellofemoral knee joint (Figure 10.5). Considering that GAG loss is associated with a number of
diseases such as osteoarthritis, the ability to directly image GAG in tissues could prove useful in diagnosis.