Biomedical Engineering Reference
In-Depth Information
by a pressure gradient. Flow is simulated in the
longitudinal direction of the cylindrical scaf-
fold, where the top and bottom of the cylinder
are set as the inlet and outlet, respectively (Fig.
10
=
µ
ρ∆
where
k
is permeability (m
2
),
˙
is mass fl ow
rate,
mL
AP
k
cs
is fl uid viscosity,
L
is scaffold length,
A
cs
is cross-sectional area,
µ
A-E).
Boundary conditions
are defi ned in
such a way that the rounded sides of the scaf-
fold are sealed, restricting fl ow from entering
or leaving in the transverse direction. The per-
fusate medium is treated as if it were water. A
pressure gradient of
.
14
r
is fl uid density, and
D
P
is the applied pressure gradient. Permeabil-
ity in the longitudinal direction is calculated in
this way and validated experimentally by using
the same mass fl ow rate (Fig.
].
This preliminary study demonstrates the
potential of using nano-micro fl uid dynamics
to predict and optimize scaffold performance
parameters, including fl uid fl ow and permea-
bility, prior to scaffold manufacture [
10
.
13
C) [
2
Pa is applied along the
length of the scaffold, even though the relation-
ship between fl uid velocities applies to a wide
range of pressure gradients. When fl ow is sim-
ulated in the longitudinal direction (top to
bottom, Fig.
100
]. Inter-
estingly, several rapid prototyped SLA scaffolds
were shown to be impermeable on the basis of
µ
2
C), differences in longitudi-
nal velocity between the through-channels (v,
Fig.
10
.
14
A) and the alternating transverse fl uid
layers (w, Fig.
10
.
14
CT and experimental measurements; this
was due to lack of continuity in the scaffold
through-channels. Had we had our predictive
model and equations prior to rapid prototyping
of the pilot scaffolds, we could have optimized
our design for function prior to the prototyping
phase.
In a further step, we have used our model to
predict the mechanobiological milieu of cells
seeded on the scaffold. For this purpose, we
again employ CFD to simulate fl uid fl ow
through a tissue-engineered scaffold based on
Navier-Stokes equations for steady fl ow induced
B) are observed. In the
through-channel geometry, velocity profi les
were similar to parabolic pipe fl ow regimes
(Poiseuille fl ow). When the through-channels
enter the transverse layers, the profi les are
similar to jet-fl ow expansion. Owing to the
increase in the volume of the transverse layer
that is due to jet fl ow expansion, an order-of-
magnitude difference was found between
through-channel
10
.
14
and
transverse
layer
velocities.
From the perspective of a cell that is attached
to the walls of the channels, shear stresses
A
B
C
1
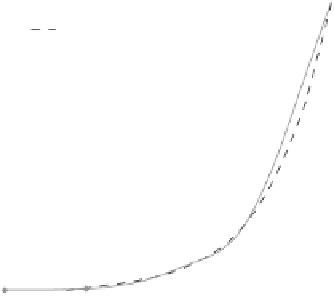
Calculated Permeability
Permeability prediction - curve fit
y = 3.6367x
4
- 4.5575x
3
+ 2.2324x
2
- 0.3116x
0.8
0.6
0.4
0.2
0
0
0.2
0.4
Pore Volume %
0.6
0.8
1
1 mm
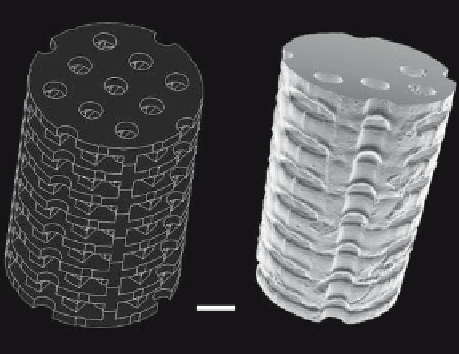
Figure 10.13.
Comparison of scaffold parameters. (A) Computer-aided design (CAD) drawing of target scaffold geometry; (B)
microcomputer tomographic (
µ
CT) image of actual manufactured prototype geometry; (C) predicted permeability (k) of scaffold.
Adapted from [2].