Biomedical Engineering Reference
In-Depth Information
Periosteum
Permeability low
Permeability medium
Permeability high
Endosteum
Medullary Canal
Setup 1
Permeability
32 1
Site
1
Porosity
Void Ratio
k
11
k
22
k
23
7%
6%
5%
0.075
0.064
0.053
2.47E-20
1.58E-20
1.00E-20
2.47E-21
1.58E-21
1.00E-21
2.47E-22
2
3
1.58E-22
1.00E-22
Setup 2
Permeability
k
11
k
22
k
23
Site
1
2
3
Porosity
Void Ratio
1
10%
8%
5%
0.111
0.087
0.053
1.00E-19
3.71E-20
1.00E-20
1.00E-20
3.71E-21
1.00E-21
1.00E-21
3.71E-22
1.00E-22
Setup 1
Setup 2
3
2
Setup 3
Permeability
POR
+3.410e+05
+2.794e+05
+2.178e+05
+1.562e+05
+9.460e+04
+3.300e+04
-2.860e+04
-9.020e+04
-1.518e+05
-2.134e+05
-2.750e+05
-3.366e+05
-3.982e+05
Site
1
2
3
Porosity
Void Ratio
k
11
k
22
k
23
15%
10%
5%
0.176
0.111
0.053
1.00E-18
1.00E-19
1.00E-20
1.00E-19
1.00E-20
1.00E-21
1.00E-20
1.00E-21
1.00E-22
Setup 4
Permeability
Setup 3
Setup 4
Site
1
2
3
Porosity
Void Ratio
k
11
k
22
k
23
5%
5%
5%
0.053
0.053
0.053
1.00E-20
1.00E-20
1.00E-20
1.00E-21
1.00E-21
1.00E-21
1.00E-22
1.00E-22
1.00E-22
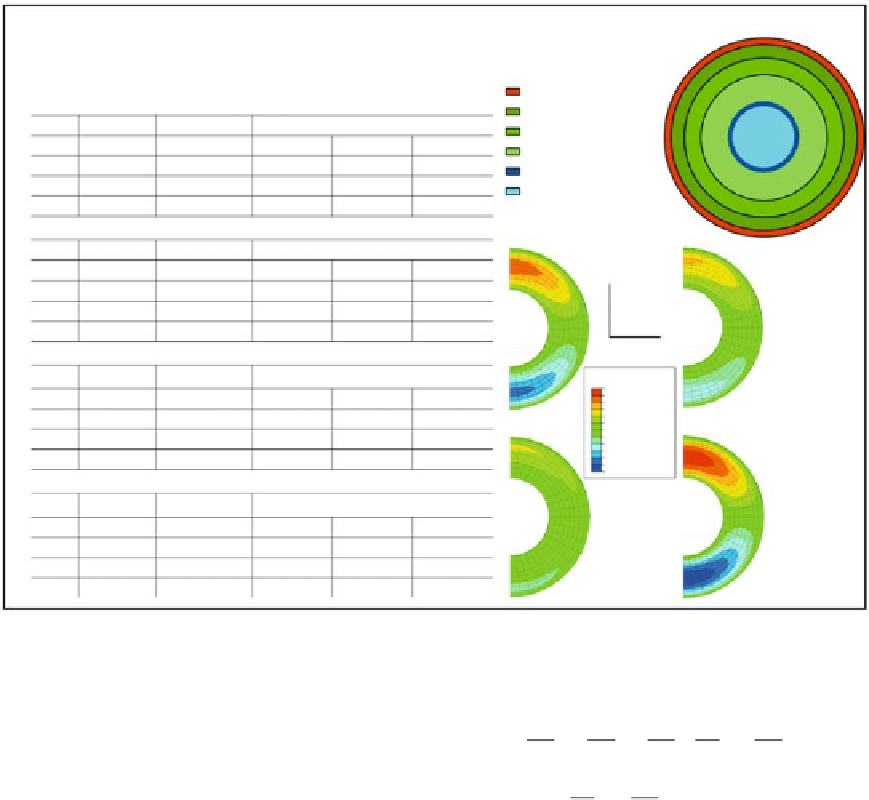
Figure 10.8.
Parametric model exploring relationships between fluid velocity magnitudes, directions, resulting tracer concen-
trations, and adaptation.
transport, a diffusion constant for our mole-
cule of interest; fl uid velocities were calculated
in the fi rst step of the model and tracer concen-
trations were calculated as a function of loca-
tion and time with the aid of the heat transfer
equations, which reduce to the
general diffu-
sion convection equation
∂
∂
C
t
∂
∂
C
x
∂
∂
C
yx
k
∂
∂
∂
∂
C
x
⎡
⎢
⎤
⎥
+
u
+
v
−
x
∂
∂
∂
∂
C
y
⎡
⎢
⎤
⎥
−+
−
k
QKC
=
0
y
y
When we calculate molecular tracer con-
centration across the tibia cortex, the areas of
highest concentration correspond to the areas
of lowest fl uid velocity. This makes sense when
one considers that the molecules will dwell
longest in areas of low fl ow and will be trans-
ported rapidly through areas of high fl ow.
Interestingly, the areas of highest adaptation in
response to the four-point bending loads
applied to in vivo models (Fig.
∂
∂
C
t
∂
∂
∂
∂
C
x
⎛
⎜
⎞
⎟
+−
=
x
k
−
uC
Q
KC
i
i
i
i
where
C(x
i
, t)
is the concentration (dependent
variable),
x
i
is the index form for cartesian coor-
dinates,
t
is the time,
k
i
are the diffusion coeffi -
cients,
u
i
are the components of the velocity
vectors calculated in the fi rst step,
Q
is the source
or sink coeffi cient (positive for source and nega-
tive for sink), and
K
is the reaction rate for the
molecule or chemical species of interest. Owing
to the extremely slow fl ow rates that prevail in
bone, acceleration (or inertial) effects can be
neglected. Thus, for the two-dimensional case,
this equation can be written in the following
form, where
u
and
v
are the location-dependent
components of the average velocity vector:
D) co-loca l-
ized better with those areas with the highest
molecular concentrations and the lowest fl ow
velocities [
10
.
9
]. This at fi rst was puzzling, inas-
much as, according to the prevailing mechano-
transduction hypotheses of the time, increasing
shear stress through increasing fl ow velocity
should have exerted a dominant effect, analo-
gous to the infl uence of fl ow on endothelial
cells in blood vessels. However, as stated above,
12