Environmental Engineering Reference
In-Depth Information
taBle 11.10
life-cycle Global Warming Potential of
electricity Generated from various sources
Global Warming Potential
(kg co
2
eq./mWh
elec
)
electricity source
10% Blend co-fire
905.7
10% Willow co-fire
882.7
Average U.S. grid
989.1
Gasified willow
40.2
Direct-fired willow
52.3
BIPV
59.4
Wind
9.7
Source:
Keoleian, G.A. and Volk, T.A.,
Crit Plant Sci Rev
,
24, 385-406, 2005.
1200
1000
800
600
400
200
0
Coal
5% Co-fire
15% Co-fire
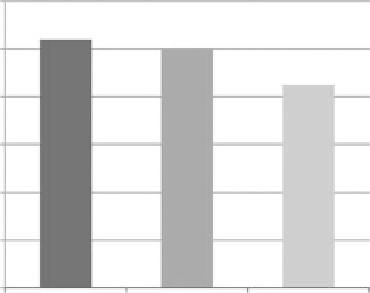
FIGure 11.28
Life-cycle GHG emissions of coal and two coal/biomass co-fire electricity systems. (From
Mann, M.K. and Spath, P.L.,
Clean Prod Processes
, 3, 81-91, 2001.)
11.3.3.2 mixed Wood Waste
One notable assumption in Mann and Spath (2001) was the exclusion of a CO
2
credit for carbon
sequestered in biomass during growth. This credit was commonly used in the biofuel studies dis-
cussed in this chapter. No credit was assigned in this study because the biomass was not originally
intended for energy production. Instead, carbon reduction credits were calculated for what was
assumed to be the biomass' avoided fate—disposal in a landfill or conversion to mulch. The frac-
tion that would have become mulch would eventually decompose and release carbon. Ten percent
of the carbon would have become CH
4
, and 90% would have become CO
2
. As for the biomass sent
to the landfill, Mann and Spath (2001) used the literature and assumed that 26% of the carbon
would be released to the atmosphere as CO
2
and 9% as CH
4
. The wood was not assumed to be
usable in durable goods, so it could not displace these products and receive a GHG emissions avoid-
ance credit. Critically, actual system operations must be understood to make appropriate modeling
assumptions and yield accurate and defensible results.
The Mann and Spath (2001) life-cycle GHG emissions are presented in Figure 11.28. Compared
with coal, 5% and 15% co-firing of wood waste biomass reduces life-cycle global warming potential