Environmental Engineering Reference
In-Depth Information
(GWP) by 5.4% and 18.2%, respectively. Nearly 90% of life-cycle CO
2
emissions in this study are
released during combustion of coal in the power plant. Again, the biomass CO
2
emissions from the
power plant are not offset by CO
2
sequestration during biomass growth, as typically assumed in
other studies.
Sensitivity analysis of the co-firing rate showed that as the biomass percentage increased, GWP
decreased faster than the decreasing rate of CO
2
emissions because CH
4
, a potent GHG, was avoided
by not landfilling or mulching the biomass. Additional sensitivity analysis results show that varying
the landfill CH
4
emission rate could change the system GWP by as much as a 28% decrease to a 3%
increase, although neither extreme is probable.
11.3.3.3 hybrid Poplar
In Mann and Spath's (1997) assessment of poplar biomass production for electricity, the carbon from
poplar wood chip combustion was assumed to be offset by carbon uptake during poplar growth, just
as in Keoleian and Volk (2005) but differing from Mann and Spath (2001). It was assumed that 2%
of nitrogen applied to the poplar fields would be released to the atmosphere as N
2
O emissions. Also,
the base case assumed no net gain or loss of soil carbon.
Only 5% of the total life-cycle CO
2
emissions were released to the atmosphere in Mann and
Spath's (1997) model, whereas the remaining 95% of CO
2
was assumed to remain within system
boundaries via biomass carbon uptake. Of the 5% fraction released, 62% was from feedstock
production, 26% from power plant construction, and 12% from transportation. The total global
warming potential, in terms of CO
2
e, was calculated as the sum of CO
2
, CH
4
, and N
2
O GHG
emissions. Mann and Spath (1997) found a life-cycle GWP of 49 g CO
2
e/kWh for poplar biomass
electricity, which is close to the gasified and direct-fired values for willow found in Keoleian and
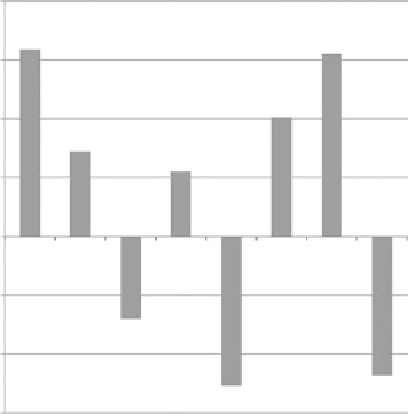
Volk (2005) (Table 11.10). The eight alternative scenarios that most strongly influenced net CO
2
emissions are shown in Figure 11.29. These scenario numbers precisely correspond to those in
Fig u re 11.25.
20%
15.9%
15.5%
S
1 = Decreased biomass yield by 33.3%
15%
S
4 = Nitrogen fertilizer applied in years 2, 4, and 6
S
4 = Reduced power plant construction materials
by 25%
10.1%
10%
7.2%
S
13 = Biomass transport distance increased 46%
S
15 = Reduced fossil fuel use in feedstock
production by 40%
S
16 = Increased fossil fuel use in feedstock
production by 50%
S
17 = Decreased power plant efficiency by 5
percentage points
S
18 = Increased power plant efficiency by 5
percentage points
5.5%
5%
0%
-5%
-7.0%
-10%
-11.8%
-12.7%
-15%
FIGure 11.29
Change in CO
2
emissions for alternative poplar biomass electricity scenarios. (From Mann,
M.K. and Spath, P.L.,
Life Cycle Assessment of a Biomass Gasification Combined-Cycle System
, National
Renewable Energy Laboratory, 1997. Available at http://www.nrel.gov/docs/legosti/fy98/23076.pdf)