Environmental Engineering Reference
In-Depth Information
11.3.3
l
ifE
-c
yclE
ghg E
miSSionS
11.3.3.1 Willow
As in the biofuel studies, the CO
2
taken in from the atmosphere by willow as it grows is sig-
nificant. However, because electricity generation is a central component of Keoleian and Volk's
(2005) analysis, and biomass provides only 10% of the power plant's fuel in the co-fire case, stack
emissions (mostly in the form of CO
2
) dominate life-cycle GHG emissions. Agriculture-related
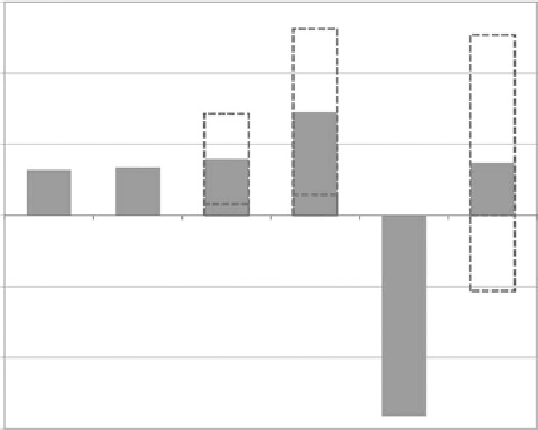
GHG emissions are shown in Figure 11.27 but do not include the carbon that was stored in the
above-ground portion of the willow plants and subsequently released from the power plant stack.
Carbon sequestration in Figure 11.27 refers to the carbon captured by plants and stored in their
roots, which remain in the ground until the end of the 23-year willow farm management schedule
(see Table 11.7).
The results in Figure 11.27 represent Keoleian and Volk's (2005) willow base case, which used
ammonium sulfate as fertilizer. N
2
O emissions are highly uncertain, as shown by the representa-
tive dashed lines in the figure, and are influenced by fertilizer type and application rate. If N
2
O
emissions were as high as the upper range of uncertainty, the net global warming potential would
increase by 240%. If the lower-end N
2
O emissions are more representative of the fertilizer type and
amount used, the agriculture phase of the willow electricity life-cycle system would result in a net
negative global warming potential. Also note that 75% of the global warming potential from agri-
culture inputs was due to fertilizer manufacture.
Table 11.10 provides the global warming potential of several biomass electricity systems along
with that of the U.S. electricity grid average, wind systems, and solar photovoltaic electricity. Biomass
electricity systems reduce global warming impacts, but not as well as other renewable technologies.
Wind energy systems can decrease the life-cycle global warming potentials by 90-99% compared
with biomass co-fire, coal, and average U.S. grid GHG emissions. As in the system net energy value
comparison, given in Table 11.8, the gasified and direct-fired willow biomass systems offer much
higher benefits than the co-fire systems. Note that the global warming potential factors calculated
for wind and BIPV systems only include CO
2
emissions.
15
10
5
Net total
0
Diesel
fuel
Agriculture
inputs
N
2
O from
applied N
N
2
O from
leaf litter
-5
-10
Carbon
sequestration
-15
FIGure 11.27
Agriculture life-cycle GHG emissions of willow excluding primary biomass carbon capture.
(Form Keoleian, G.A. and Volk, T.A.,
Crit Plant Sci Rev
, 24, 385-406, 2005.)