Biomedical Engineering Reference
In-Depth Information
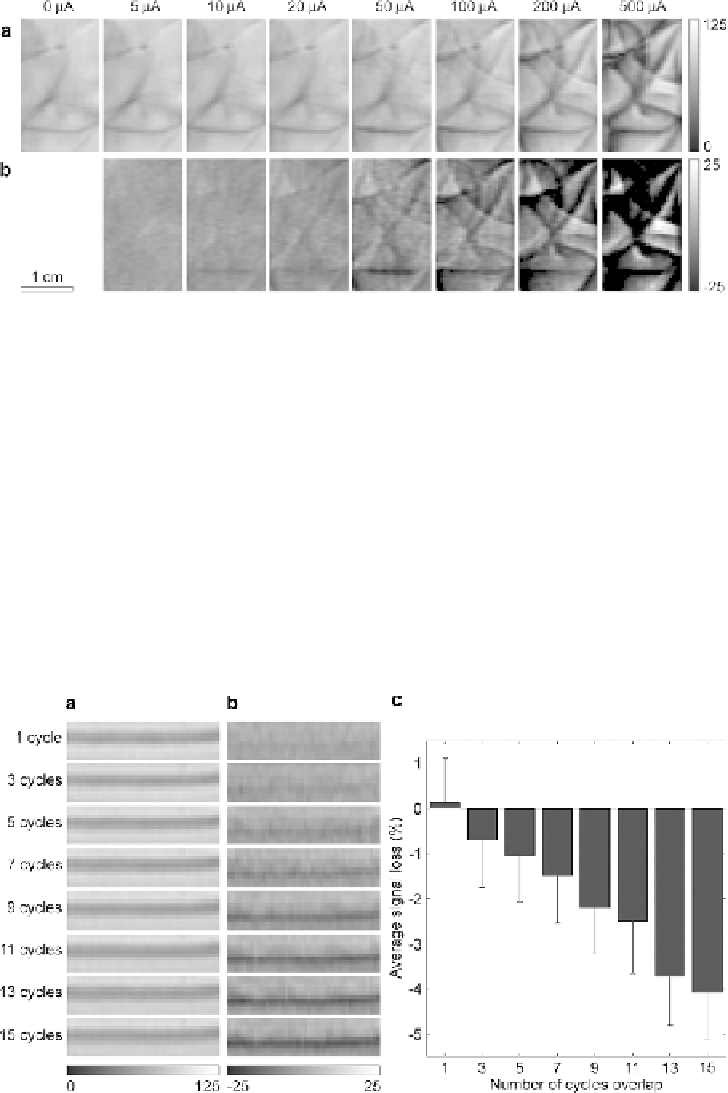
Fig. 14.5. Current intensity dependence for randomly oriented currents. (
a
) Images of a selected region of phantom B
acquired with different current intensities. (b) Corresponding difference images with the image acquired without current.
The signal intensity is expressed in percentage of the maximum signal in the image acquired without current.
not orthogonal to the main magnetic field experienced a smaller
Lorentz force and therefore a smaller signal loss.
The results of the third phantom study are shown in
Fig. 14.6
As
expected, the signal loss progressively increases with the amount
of overlap between the current pulses and the positive lobes of
the oscillating gradients, which can be clearly seen on both the
difference images (
Fig. 14.6b
) and the plot of the average signal
loss within the entire region (
Fig. 14.6c
).
5.1.3. Dependence on the
Synchronization between
the Current and the
Oscillating Gradients
Fig. 14.6. Dependence on the synchronization between the current and the oscillating gradients. (
a
) Images of a
selected region of phantom A containing the wire acquired with a 500 μA current intensity and different amounts of
overlap between the current pulses and the positive lobes of the oscillating gradients. (
b
) Corresponding difference
images with the image acquired without overlap, illustrating the signal loss as a function of the intravoxel dephasing, but
not of the displacement itself. (
c
) Signal loss averaged over the region shown in (
a
)and(
b
) for the different amounts of
overlap. The signal intensity in (
a
), (
b
), and (
c
) is expressed in percentage of the maximum signal in the image acquired
without overlap.