Biomedical Engineering Reference
In-Depth Information
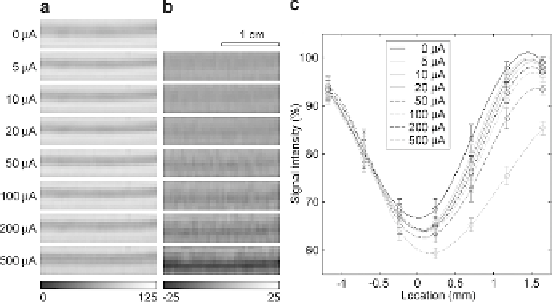
Fig. 14.4. Current intensity dependence for a straight current. (
a
) Images of a selected
region of phantom A containing the wire acquired with different current intensities. (
b
)
Corresponding difference images with the image acquired without current. (
c
) Signal
intensity profiles across the wire averaged over the section shown in (
a
)and(
b
) for the
different current intensities. The lines are computed using cubic spline interpolation. The
signal intensity in (
a
), (
b
), and (
c
) is expressed in percentage of the maximum signal in
the image acquired without current.
dephasing due to the Lorentz force induced incoherent displace-
ment, occurs only on one side of the wire, as shown on the plot of
the average signal intensity profiles across the wire (
Fig. 14.4c)
.
Similar results are obtained when the direction of the current is
reversed, except that the signal loss occurs on the opposite side.
The widening can reach up to 750
μ
m (full width at half max-
imum) for a current intensity of 500
A, with a corresponding
maximal signal loss of 25%. However, currents as low as 5
μ
μ
A can
still be detected.
Although the signal loss was only observed on one side of the
wire, since the latter does not adhere to the gel, it is important
to note that even if this were not the case (e.g., for a neuron
surrounded by tissue), a dilation of the elastic medium on the
opposite side would induce a spatially incoherent displacement as
well, and thus, a loss of phase coherence similar to that induced
by the compression of the elastic medium, resulting in a signal
loss on both sides and making the technique more sensitive.
The results of the second phantom study are shown in
Fig. 14.5
and demonstrate that the LEI technique does not require unidi-
rectional currents. As for the straight wire in the first study, the
signal losses correspond to the wire locations and become more
pronounced with increasing current intensities, which can be
clearly seen on both the original images (
Fig. 14.5a
) and the dif-
ference images (
Fig. 14.5b
). The overall signal loss dependence
on the current intensity is highly comparable to that observed
for the straight current. However, because of the directional
dependence of the LEI signal, the segments of wire that were
5.1.2. Current Intensity
Dependence for Randomly
Oriented Currents