Biomedical Engineering Reference
In-Depth Information
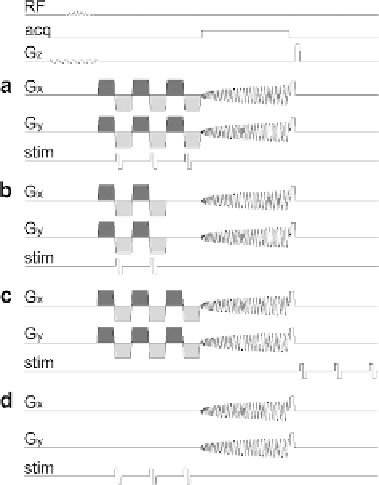
Fig. 14.3. Pulse sequence diagrams for the in vivo experiments. Timing of the
radiofrequency excitation pulse (RF), the data acquisition window (acq), the magnetic
field gradients on the slice selection (G
z
), readout (G
x
), and phase encoding (G
y
) axes,
and the current applied by the stimulator to the wrist (stim) for: (
a
) Three cycles of
gradient oscillations (shown in dark and light gray) and three electrical pulses triggered
at the onset of the negative gradient lobes (Exp. 1); (
b
) the same as (
a
) but with two
cycles of gradient oscillations and two electrical pulses (Exp. 2); (
c
) the same as (
a
) but
with the electrical pulses delayed by 50 ms (Exp. 3); (
d
) the same as (
a
) but without
oscillating gradients (Exp. 4).
one pixel were discarded (
10% of the runs). Voxel-by-voxel
linear detrending was applied to remove any linear drift in the
MRI signal. A group student's
t
-test (one-tailed) was then carried
out to detect significant differences between the images acquired
during the rest and stimulation periods. The
t
-score maps were
converted to
Z
-score maps and thresholded using a
Z
-score of
Z
∼
10
−
7
uncorrected for multiple comparisons) and a cluster size of five
voxels. Finally, the resulting activation maps were overlaid on the
coregistered high-resolution anatomical images.
>
5 (corresponding to a significance level of
P
<
2. 5
×
5. Results
5.1. Phantom
Experiments
The results of the first phantom study are shown in
Fig. 14.4
.As
expected, the central signal dip observed on the image acquired
without current (
Fig. 14.4a
), which is due to the presence of
the wire, becomes progressively larger and wider with increasing
current intensities, as can be seen more clearly on the difference
images (
Fig. 14.4b)
. This signal loss, caused by the intravoxel
5.1.1. Current Intensity
Dependence for a Straight
Current