Biomedical Engineering Reference
In-Depth Information
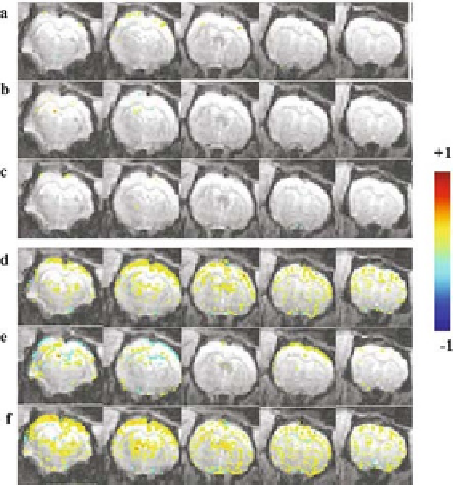
Fig. 12.3. Spatial correlation of low frequency BOLD signals from five contiguous slices
from a typical rat. The anatomical underlay consists of a single EPI image of the brain
and the functional overlay is the correlation coefficient in the absence of any stimulus
during (
a-c
) normal and (
d-f
) exsanguinated conditions. Voxels from the whole brain
were low-pass filtered (cut off 0.1 Hz) on a voxel wise basis and subsequently cross-
correlated with the time course of a seed voxel obtained from (
a,d
) sensorimotor cortex
(
b,e
) hippocampus and (
c,f
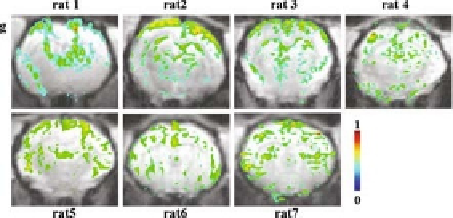
) thalamus. (
g
) Typical cross-correlation maps from a single
coronal slice during exsanguinated conditions over all rats after cross-correlation with
the time course of a seed voxel obtained from the sensorimotor cortex. A threshold
(≥0.3 for the correlation coefficient (P
<
10
−
6
) was used to generate all correlation
maps. The seed voxel location shows a high correlation coefficient value in the images.
(
See
Color Plate)
each of the stereotaxically defined anatomical regions of interest
increased during exsanguination when compared to normal phys-
iological conditions. The average correlation coefficients from
various anatomical regions of interest over all rats is shown in
Table 12.2
.
A sign and binomial test was performed under the hypothesis
that an increase in mean correlation coefficient in the cortex with
exsanguination was a “success” and a decrease in mean correlation