Biomedical Engineering Reference
In-Depth Information
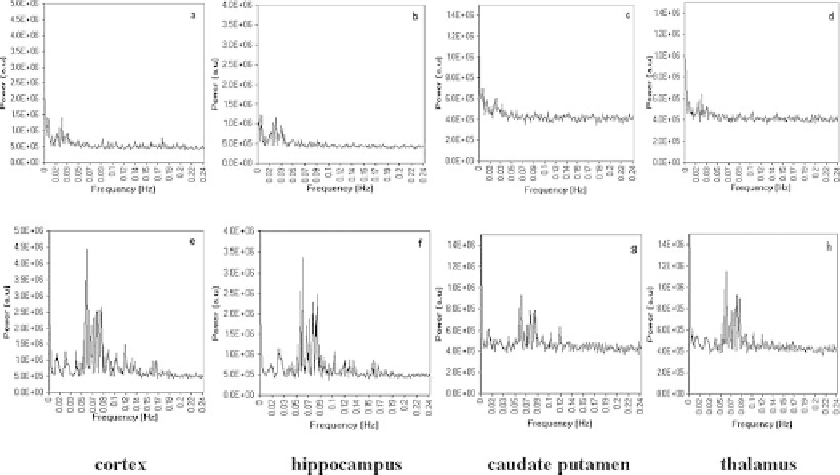
Fig. 12.2. Average power spectra of the BOLD signal from different regions of interest namely cortex, hippocampus,
caudate putamen and thalamus in a typical rat during (
a-d
) normal and (
e-h
) exsanguinated conditions.
(
Fig. 12.1d
), led to an increase in the area of correlated vox-
els from both hemispheres after cross-correlation with a seed
voxel time course chosen from different ROI's (
Fig. 12.3d-f)
.
Correlated voxels in the hippocampus and thalamus across both
hemispheres emerged during exsanguination when correlated
with a seed voxel obtained from the hippocampus (
Fig. 12.3e
)
and thalamus (
Fig. 12.3f)
. The correlation maps were distinct
depending on the anatomical region of choice of the seed voxel
in any single rat. The correlation maps were reproducible across
all seven rats.
Figure 12.3g
shows the correlation map obtained
after cross-correlating the time course of voxels from the whole
brain with a seed voxel from the sensorimotor cortex during
exsanguination across all seven rats. The pattern of activation was
approximately similar and exhibited bilateral symmetry over each
hemisphere over all rats.
Statistical analysis was performed across all rats to determine
the extent of spatial correlation between regions. The average
correlation coefficients of stereotaxically defined regions namely
cerebral cortex, caudate putamen, hippocampus and thalamus
(using seed pixels from the cerebral cortex) were determined
over each rat and compared among all rats. The average corre-
lation coefficient was the largest in the cerebral cortex, and the
least in the hippocampus both during normal and exsanguinated
conditions (
Table 12.1
). The correlation of cerebral cortex was
relatively better with caudate putamen and thalamus when com-
pared to the hippocampus. The average correlation coefficient for