Biomedical Engineering Reference
In-Depth Information
A
V1
SC
DLG
P < 0.001
P < 0.0001
B
C
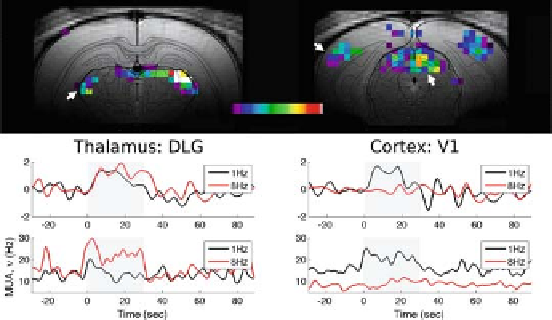
Fig. 10.4. Multi-modal responses from the visual cortex during bilateral light stimula-
tion (white; 50 ms pulses; 30 lux) in Long Evans rats. (
A
) Cortical and subcortical BOLD
responses with 1 Hz stimulation applied for 30-s duration. Data from five trials in one
animal were averaged and the t maps were generated by comparing the mean signals
in a 30-s baseline period before the stimulation block. The MRI data were overlaid on
the structural outlines from the atlas of Paxinos and Watson (53). Bilateral responses
were observed in the dorsal lateral geniculate nuclei of the thalamus (DLG; left), the pri-
mary visual cortex (V1; right), and the dorsal layers of the superior colliculus (SC; right).
At higher frequencies, there were weaker BOLD responses in the cortex. Results with
green light were qualitatively similar to these results with white light. The time courses
of (
B
)BOLDand(
C
) MUA responses to 1 Hz (black line) and 8 Hz (red line) stimuli in
DLG (left) and V1 (right) from single trial runs. (
B
) The BOLD responses were calculated
by averaging several activated voxels within a region-of-interest (in a single trial) from
the maps shown above. (
C
) The MUA responses were obtained from another animal but
under similar experimental conditions (white; 1 Hz, 50 ms pulses; 23 lux). The coordi-
nates of DLG and V1 were guided by prior fMRI results: DLG: [-4.8 mm posterior, -3.8
mm lateral to bregma, -4.0 mm ventral from dura]; V1: [-5.6 posterior, -3.9 lateral to
bregma, -0.9 mm ventral from dura at an angle of 10
◦
from the vertical axis]. The 30-s
stimulation period is indicated by the shaded region. (
See
Color Plate)
4). Bilateral, white light (50 ms pulses; 1 Hz; 30 lux) stimulation
elicited reproducible bilateral BOLD activations (
Fig. 10.4A
)in
the dorsal lateral geniculate nuclei of the thalamus (DLG), the
primary visual cortex (V1), and the dorsal layers of the superior
colliculus (SC). Both the amplitude (
2%) and locations (DLG,
V1, SC) of the BOLD response are in good agreement with prior
fMRI results from Long-Evans rats
(37)
. At higher stimulation
frequencies, localized BOLD time courses from the DLG and
V1 regions (
Fig. 10.4B
) revealed a weaker response in V1 and a
slightly stronger response in DLG. The MUA signals from these
regions were in general agreement with the fMRI findings (
Fig.
10.4C)
. Results with green light (data not shown) were qualita-
tively similar to the results shown for white light.
∼
3.3. Whisker
Stimulation
We explored whisker stimulation induced activity patterns in
the somatosensory area (
Figs. 10.5 and 10.6)
. There were no
stimulation-induced variations in systemic physiology for whisker