Biomedical Engineering Reference
In-Depth Information
lateral foci
medial foci
A
L
P < 0.001
L
R
R
P < 0.01
14%
L
R
L
R
B
10%
6%
2%
-2%
0
5
10
15
20
25
0
5
10
15
20
25
Time (image #)
Time (image #)
C
0
10
20
30
40
50
60
70
80
90
0
10
20
30
40
50
60
70
80
90
Time (sec
)
Time (sec
)
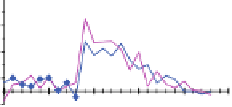
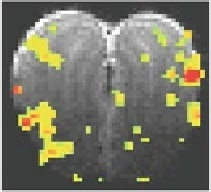
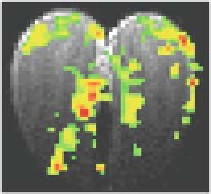
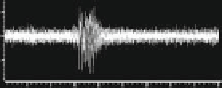
Fig. 10.3. Multi-modal responses from the olfactory bulb in Sprague-Dawley rats. Lat-
eral (left) and medial (right) responses as measured by BOLD and LFP during hexanal
(100%) exposure. (
A
) The BOLD activation maps from slices 8 (
left
)and13(
right
)
situated from anterior-to-posterior in one subject where the entire olfactory bulb was
imaged using 20 coronal slices with 250 μm thickness. The t maps were generated by
comparing the mean signals in a 60-s baseline epoch before the odorant exposure. The
circles shown in the BOLD maps identify the lateral (left) and medial (right) foci that were
probed by electrophysiology (see below). (
B
) The BOLD responses from the circled (L,R)
regions in each slice. Comparison of the two BOLD traces in the lateral (left) and medial
(right) regions depicts the inter-bulbar differences (L,R). (
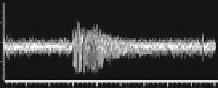
C
) The LFP responses mea-
sured from another animal but for the same odorant and the lateral/medial areas shown
above. The lateral (left) and medial (right) LFP signals were made from the left and right
olfactory bulbs, respectively. The exposure periods are indicated by the black bars in the
middle and bottom rows. All data shown are from single trial runs. (
See
Color Plate)
isoamyl acetate
(56)
. The LFP recordings demonstrated compli-
cated dynamic evoked patterns that suggest multiple frequency
components, ranging between 5 and 25 Hz, where latencies of
both medial and lateral responses were about 1 s. While these
fMRI-guided LFP results partially agree with classical LFP record-
ings from the olfactory bulb
(57)
, further characterization of the
LFP response is needed to distinguish between the latencies and
the different frequency components
(58)
, for different regions
and/or odorants.
3.2. Visual
Stimulation
We investigated light-induced activity patterns in the visual areas
of the brain (
Fig. 10.4)
. There were no stimulation-induced
variations in systemic physiology for the intensities (20-40 lux)
or colors (white, green) of light examined (data not shown;
n
=