Biomedical Engineering Reference
In-Depth Information
d
l
P < 0.001
m
P < 0.01
v
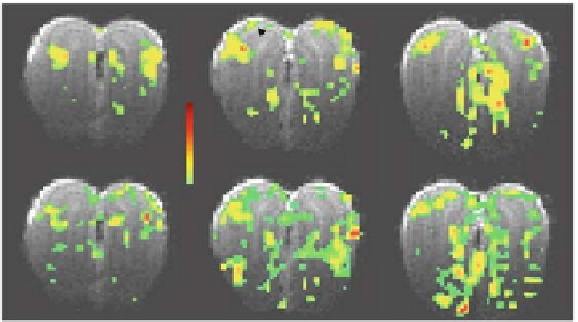
Fig. 10.2. BOLD responses from the olfactory bulb in Sprague-Dawley rats. The rat was
exposed to isoamyl acetate (100%) and hexanal (100%) for a duration of 60 s each. The
tmaps were generated by comparing the mean signals in a 60-s baseline period before
the odorant exposure. Odor-elicited activation patterns were imaged in 10 coronal slices
with 500 μm thickness, of which three slices (4-6) are shown anterior-to-posterior (left
to right). Both odors elicited distributed, yet non-identical responses throughout the bulb.
Dorsal (d), lateral (l), and medial (m), and vental (v) foci are identified by arrows. All data
shown are from single trial runs. (
See
Color Plate)
any stimulation-induced variations in systemic physiology (data
not shown). In agreement with prior fMRI findings using a vari-
etyofodorants
(26, 54, 55)
, the strongest BOLD activations were
located mainly within the glomerular and olfactory nerve layers.
Together, these layers comprise the outermost layers of the olfac-
tory bulb and span about 100
μ
m in the thinnest region to about
μ
500
m in the widest region of the olfactory bulb. While both
isoamyl acetate and hexanal elicited patterns with some degree
of overlap in dorsal, lateral, and medial regions, hexanal gen-
erated much stronger ventral activations. In prior fMRI studies
with esters and aldehydes
(54, 55)
, we found presence of ven-
tral activations for aldehydes of different carbon lengths. For a
given odorant, the activation patterns were not exactly symmet-
rical across the two bulbs, perhaps due to individual variations of
air intake capabilities of each nostril. In all cases examined (
n
=
5), inter-bulbar asymmetries within one subject were much larger
than intra-animal experimental variations. We refer to our previ-
ous studies
(26, 55)
for extensive discussion of activation patterns
in the olfactory bulb.
Due to the strong medial and lateral BOLD activa-
tions observed with hexanal, we compared the BOLD signal
changes with LFP recordings in the same locations (
Fig. 10.3)
.
The BOLD activation maps were used to identify the lat-
eral and medial foci (
Fig. 10.3A,B
)fortheLFPrecordings
(
Fig. 10.3C)
. The strong BOLD response during hexanal stim-
ulation (6-10%) is in good agreement with prior fMRI results for