Biomedical Engineering Reference
In-Depth Information
activities, measured electrophysiologically by multifocal ERG
(13)
. Multifocal ERG (VERIS, EDI, San Mateo, California) mea-
sures the local neuronal activity in multiple small regions in the
posterior retina, when presented (on a TV monitor) with achro-
matic flicker which alternates independently between black and
white in individual hexagonal segments
(25)
. The correlation was
evaluated between the amplitudes of the focal ERG responses and
optical signals at the corresponding locations, from the same eye.
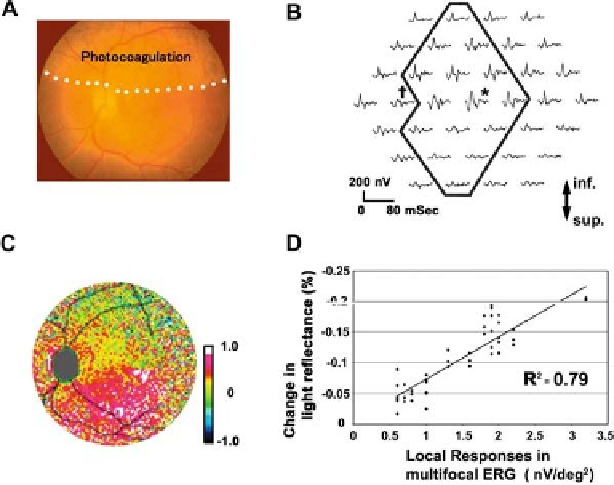
In order to artificially reduce the function of the photoreceptor
layer of the retina, the upper half of the left fundus of a mon-
key was locally coagulated with Argon Laser photocoagulation
(
Fig. 6.5A
). The electrophysiological responses in the damaged
region were reduced accordingly (
Fig. 6.5B
). In intrinsic signal
imaging, the damaged region also showed smaller amount of light
reflectance decrease (
Fig. 6.5C
). The light reflectance decrease
and the multifocal ERG signal showed statistically significant pos-
itive correlation (r
2
= 0.79, p
<
0. 001, n
=
45) (
Fig. 6.5D
). The
Fig. 6.5. (
A
) Photograph of the monkey's retina artificially damaged by Argon Laser
Photocoagulation. The upper half of posterior retina was densely coagulated, sparing the
macular area. (
B
) Array of 37 local responses of multifocal ERG, taken from the fundus
in (
A
). ERGs with ∗ and
†
indicate the location of macula and optic disk, respectively.
Note that the responses of the intact retina in the lower half region are inversely shown
in the upper half of the arrays. (
C
) pseudocolor map of flash-evoked intrinsic signals
measured with infrared light. Red color indicates light reflectance decrease (darkening)
from pre-stimulus level. Flash-evoked darkening could not be observed in the damaged
region (upper half). (
D
) Correlation between the change in light reflectance decrease
and the focal responses in ERG at the corresponding retinal location under infrared light.
Correlation coefficient: r
2
=0.79(p
<
0.001, n=45). (
See
Color Plate)