Biomedical Engineering Reference
In-Depth Information
However, with infrared observation light (840-900 nm), the
results differ. The whole posterior region of the retina became
darker after the stimulus and the pseudocolor map shows that the
most prominent decrease in light reflectance was at the center
(
Fig. 6.3B
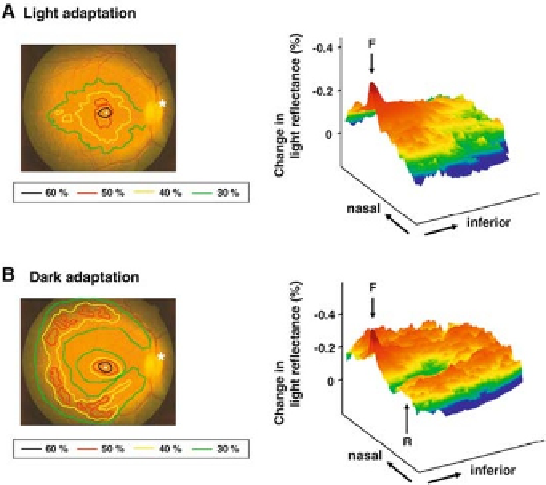
). The response topography under the light-adapted
condition demonstrated a steep peak of darkening at the fovea,
together with a gradual decrease of signal intensity away from
the fovea toward the periphery (
Fig. 6.4A
). This is consistent
with the topography of psychophysical cone sensitivity in normal
human subjects measured with bright background
(19-21)
.Ifthe
optical signal reflects the central accumulation of cone photore-
ceptors under the light-adapted condition, the local retinal region
with high rod density, called the 'rod ring', should also be acti-
vated under the dark-adapted condition. Following forty minutes
of dark adaptation, the intrinsic signal showed additional peaks
along the circular region surrounding the macula at the eccentric-
ity of the optic disk, together with the central peak at the fovea
(
Fig. 6.4B
)
(22-24)
.
In order to ensure that the intrinsic signals reflect the neu-
ronal activities in retina, the local optical signal values under
light-adapted condition were compared with the local neuronal
Fig. 6.4. Response topography of normal retina under light-adapted (
A
) and dark-
adapted (
B
) conditions. The foveal center is indicated by a white dot and the optic disk
is indicated by an asterisk. Regions with 60%, 50%, 40% and 30% of the peak signal
intensity value at the fovea were outlined by different colors. Pseudocolor topographic
maps of light reflectance changes in the inferior retina, profiled along the horizontal
meridian, are shown on the right. The location of the fovea is indicated by F, and the
crest of 'rod ring' is indicated by R. (
See
Color Plate)