Biomedical Engineering Reference
In-Depth Information
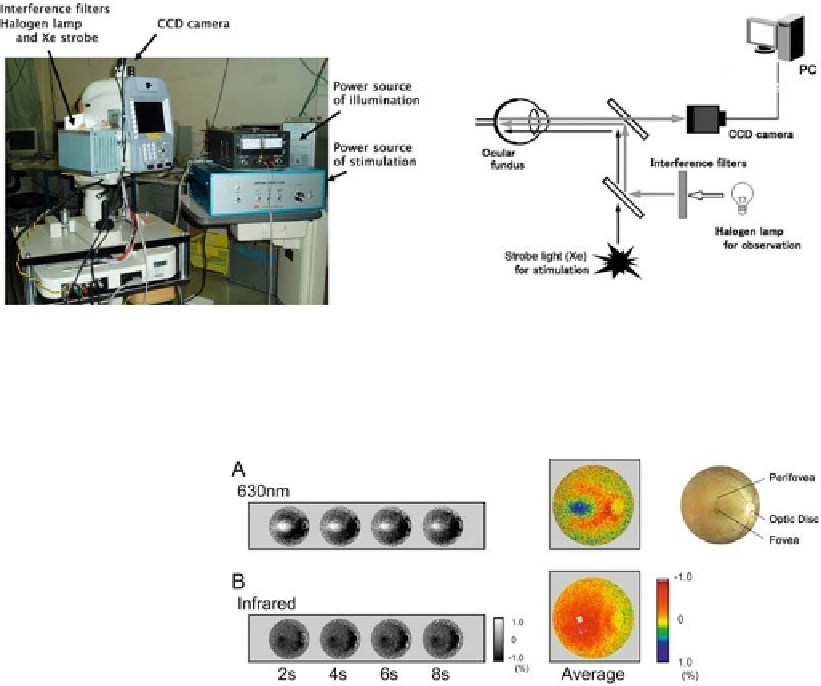
Fig. 6.2. Overall view of the intrinsic signals imaging system for retina (left) and schematic drawing of the experimental
setup (right). Throughout the recording trial, the fundus was continuously illuminated with observation light through one
of the bandpass filters. (
See
Color Plate)
Fig. 6.3. Time courses of two-dimensional images of retina showing light reflectance
changes following a flash stimulus observed with 630 nm (
A
) and infrared (
B
) light, mea-
sured in the posterior pole region of normal retina. The averaged reflectance changes
during the first second after the flash are shown in pseudocolor maps on the right. Color
indicates relative light reflectance changes from pre-stimulus level. Fundus photograph
of a normal macaque retina is shown in the right. (
See
Color Plate)
regions have different polarities. In the foveal region, the
contribution of brightening by photopigment bleaching is greater
than that of darkening by light scattering changes.
In retinal optical imaging, we need to take into account
two points when visible light is used for OISI: (1) Visible light
for observation evokes neural activity and the reflectance can
be changed without giving flash stimuli. The baseline retinal
reflectance is thus unstable during recording.(2) Following
bleaching of photopigments under visible light, the foveal
reflectance is dramatically increased (retinal image becomes
brighter) and this bleaching-related reflectance change has an
opposite polarity to conventional intrinsic signals, which are
commonly observed as decreases in light reflectance (retinal
image becomes darker).