Image Processing Reference
In-Depth Information
Image X
Image Y
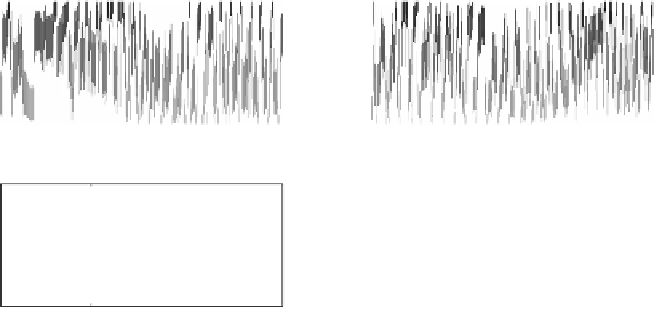
Ordered tolerance classes in X
Ordered tolerance classes in Y
30
47
222
215
y (subimages in Y)
x (subimages in X)
1
1
0.5
0.5
0
0
0
200
400
600
0
200
400
600
x (subimages in X)
y (subimages in Y)
FIGURE 8.12: Sample images, their ordered tolerance matrices and plot of the
number of overlaps
TABLE 8.2
Similarity measure calculated for different values of tolerance level (
) and subimage size
p
(
)
p
#Tol-X
#Tol-Y
TOD
HSM
tNM
B
B
B
B
B
B
B
B
B
B
1
2
1
2
1
2
1
2
1
2
10
0.01
425
526
423
534
0.96
0.98
0.86
0.86
0.74
0.45
10
0.05
401
592
411
606
0.91
0.90
0.86
0.86
0.86
0.68
10
0.10
399
603
425
620
0.88
0.88
0.86
0.86
0.87
0.73
10
0.20
384
614
371
602
0.83
0.85
0.86
0.86
0.91
0.88
20
0.01
86
124
78
126
0.94
0.97
0.86
0.86
0.58
0.34
20
0.05
96
133
102
134
0.91
0.92
0.86
0.86
0.74
0.59
20
0.10
92
132
100
136
0.87
0.89
0.86
0.86
0.78
0.72
20
0.20
90
124
86
120
0.83
0.84
0.86
0.86
0.88
0.89
visually demonstrate the similarity between pairs of images, a
similarity matrix
demonstration scheme is used here in which the similarity between pairs of images
in a set of
N
images is shown as a symmetric
N ×N
matrix. Let
I
=
{I
,I
, ..., I
N
}
1
2


Search WWH ::

Custom Search