Image Processing Reference
In-Depth Information
(8.13a)
(8.13b)
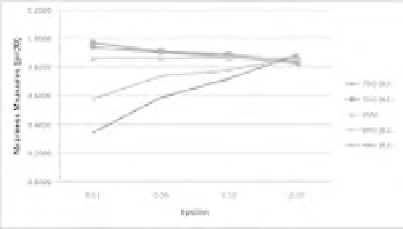
FIGURE 8.13: (Please see color insert) tNM, HSM and TOD for different values of
tolerance level, subimage size
p
=10
,
20
s
ij
be a set of images. Let
is one kind of similarity (nearness) measure between
image
I
i
and image
I
j
. The similarity matrix is
SM
=
{s
ij
}
and is graphically
shown with a square of
picture elements (cells) where each picture element
is shown with a gray scale brightness value of
N × N
s
ij
. Full similarity (identical)
is shown with 1 (white) and the complete dissimilarity is shown with 0 (black). If
the image database can be classified into subsets of conceptually similar images, it
is expected that similarity is high (bright) within images of a subset and low (dark)
between subsets.
gr
=
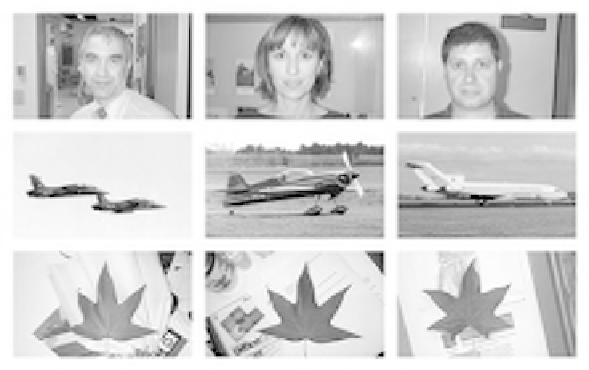
FIGURE 8.14: Selected images from Caltech image database
Example 8.8
Figure 8.14 shows 9 sample images randomly selected from Caltech vision group


Search WWH ::

Custom Search