Database Reference
In-Depth Information
Many users of reports are accustomed to analyzing data using spreadsheets. They prefer the abil-
ity to see worksheets in a tabbed format and would like to see this functionality in a report. We
would like to be able to click on each tab to show the desired presentation of our data and at the
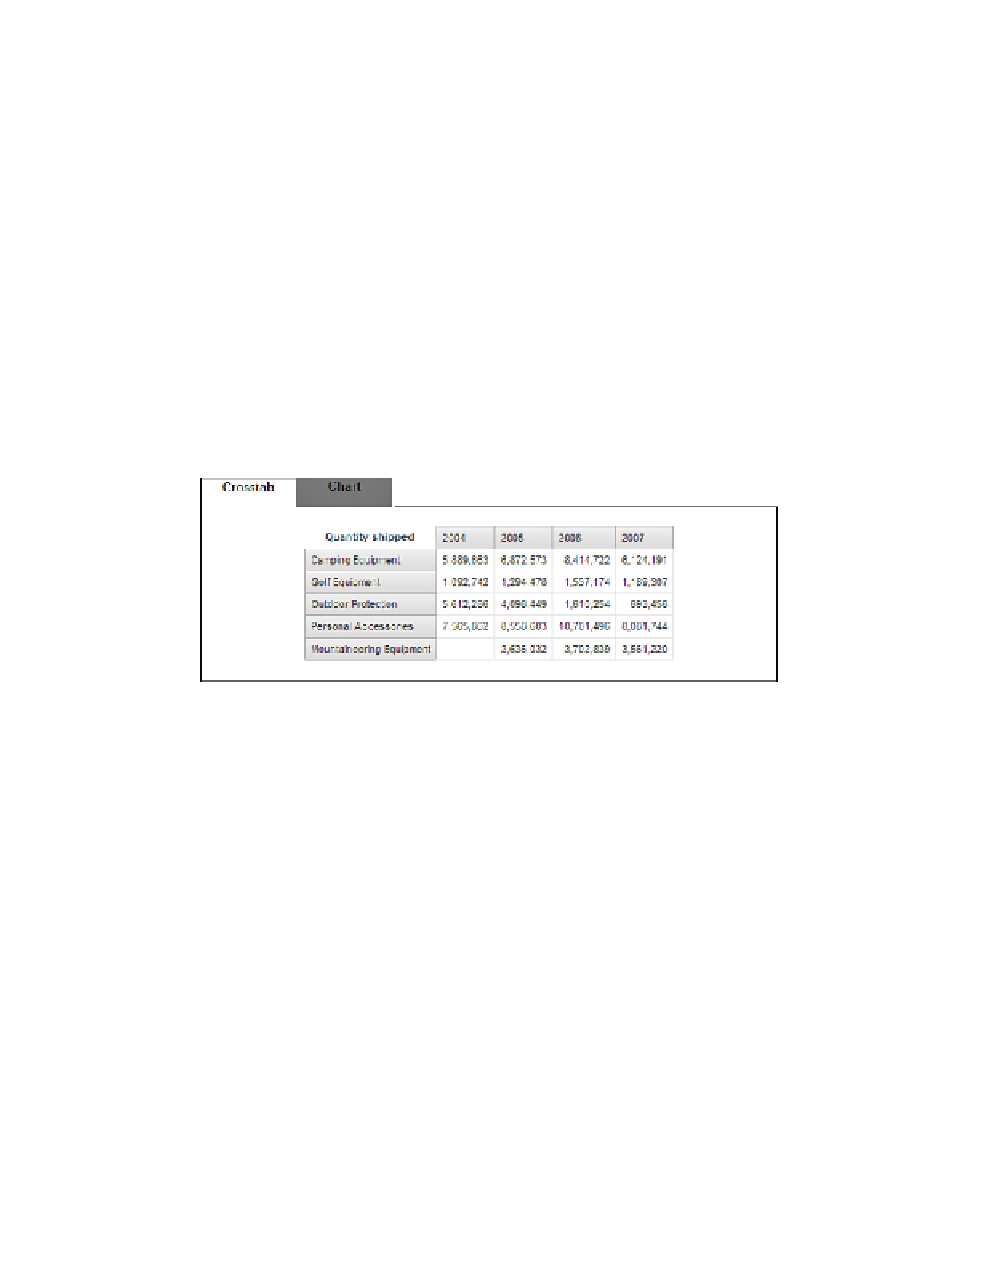
same time make the user feel as though they are in a spreadsheet environment. This example will
be presenting the quantity shipped by product line and year. The results will be displayed as a
crosstab in one tab and a chart in another. This will be accomplished by the simulation of “active”
and “not active” tabs with the use of borders and cell shading (i.e., white and gray).
The HTML coding will infuse functionality by making certain areas of the report action-
able, while careful formatting will add to the proper look and feel of tabs that are being activated
and navigated through.
The final result we are trying to achieve should look similar to Figure 5.1.
Figure 5.1
Completed tab example
This report should be rendered in HTML format to make it interactive and have some HTML
coding added to make it behave like a spreadsheet.
The key to this report is to place the block objects and HTML tags in the correct order.
The two main HTML tags that will create the desired effects will be the
<DIV>
and
<SPAN>
tags:
•
<DIV>
tags are used to identify the section of a web page in order to apply some com-
mon formatting. This tag provides some visual changes (the look and feel) to the parts of
the web page that are enclosed within the tag.