Environmental Engineering Reference
In-Depth Information
12.4.5 Adsorption of Acetic Acid
Acetic acid is one of the unwanted deposition products of ethanol in both acidic and
basic media [Colmenares et al., 2006; Rousseau et al., 2006]. Preliminary data on
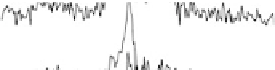
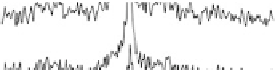
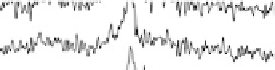
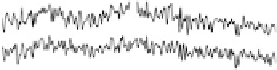
adsorption of acetic acid in acidic media are shown in Fig. 12.15. The potential was
swept from 0 V to 1.0 V and then back to 0 V at 1 mV/s, while the SFG spectra
were recorded. Between about 0.33 and 0.81 V (Fig. 12.15a), a transition was found
near 1420 cm
21
that is due to symmetric OCO stretching of adsorbed acetate ions
[Corrigan et al., 1988; Rodes et al., 1994; Delgado et al., 2005]. The blueshift
in frequency with the electrode potential produces a low Stark tuning slope of
10 cm
21
/V (Fig. 12.15c). On the positive run, the maximum of acetic acid adsorption
occurs when the electrode potential reaches 0.60 V. Further increases reduce acetic
acid adsorption owing to Pt surface oxide formation, which is reflected in the voltam-
mogram in Fig. 12.13b. At 0.87 V and above, acetic acid adsorption is no longer
observed. On the reverse scan, acetic acid adsorption occurs only after the Pt surface
oxide is significantly reduced. The adsorption then increases with increasing potential,
and reaches a maximum at around 0.40 V.
In this study, adsorption of acetic acid under voltammetric conditions was
observed by a vibrational technique for the first time. The first work in the
field was carried out using FTIR (potential difference infrared spectroscopy,
PDIRS) and by radioactive labeling [Corrigan et al., 1988]. Both techniques
Figure 12.15 (a) Potential-dependent SFG spectra of the symmetric OCO stretch from acetic
acid adsorbed on a polycrystalline Pt electrode in 0.1 M H
2
SO
4
electrolyte with 0.01 M acetic
acid. Each spectrum was acquired for 60 s (forward scan data only are shown). (b) A cyclic vol-
tammetric curve for 0.1 M H
2
SO
4
electrolyte with 0.01 M acetic acid solution between 0 and
1.0 V at 1 mV/s with the superimposed amplitude - electrode potential plots (vs. RHE) in
forward and backward directions. (c) Stark tuning data for acetic acid adsorption on platinum.


Search WWH ::

Custom Search