Environmental Engineering Reference
In-Depth Information
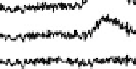
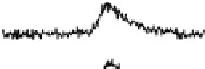
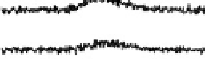
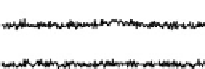
Figure 12.14 SFG spectra of the carbonyls formed during formic acid decomposition on a
Pt(111) electrode in 0.1 M H
2
SO
4
electrolyte containing 0.1 M formic acid. The spectral pos-
ition is typical of atop CO on the Pt(111) surface. Times at which the spectra have been recorded
are from 2 to 496 s, yielding HCOOH decomposition kinetics at three electrode potentials,
20.200, 20.025, and 0.225 V vs. Ag/AgCl.
atop CO on the Pt(111) surface. (Data with multiply bonded CO will be presented else-
where [Behrens et al., submitted].) Times at which the spectra were recorded are
shown. At 20.025 V, data show that maximum CO coverage is obtained after
about 120s of the decomposition process, but at the remaining two potentials the
kinetics are slower.
Overall, we demonstrated electrode potential- and time-dependent properties of the
atop CO adsorbate generated from the formic acid decomposition process at three
potentials, and addressed the issues of formic acid reactivity and poisoning [Samjeske
and Osawa, 2005; Chen et al., 2003, 2006]. There is also a consistency with the previous
kinetic data obtained by electrochemical methods; the maximum in formic acid
decomposition rates was obtained at 20.025 V vs. Ag/AgCl or 0.25 V vs. RHE
(cf. Fig. 12.7 in [Lu et al., 1999]). However, the exact path towards the CO formation
is not clear, as the main reaction is the oxidation of the HCOOH molecule:
HCOOH
!
CO
2
þ
2H
þ
þ
2e
(12
:
10)
If the CO is formed from formic acid dehydration,
HCOOH
!
CO
þ
H
2
O
(12
:
11)
the rate of reaction should be electrode-potential-neutral, which is not the case (see
Fig. 12.14 and data in [Lu et al., 1999]). The presence of a formate immediate on
rough polycrystalline Pt was found at higher potentials [Chen et al., 2003; Samjeske
et al., 2005; Samjeske and Osawa, 2005], which has not been confirmed in this report.


Search WWH ::

Custom Search