Biomedical Engineering Reference
In-Depth Information
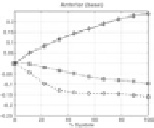
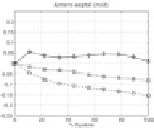
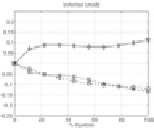
Figure 28.
Average Lagrangian normal strain plots for the twelve basal and mid-cavity
regions of the left ventricle of a normal human volunteer. The different geometric shapes
(diamond, circle, and square) represent the radial, circumferential, and longitudinal strain
values, respectively. The
x
axis marks the time point during systole.
is needed to formulate a physiological explanation for the abnormal strain patterns.
The observant reader will notice that the residuals are close to an order of magnitude
larger for the human data relative to the canine data. Applying our parametrically
optimal model to different datasets provides no guaranteed upper bounding of the
residuals, but rather the resulting residuals will naturally vary depending on the
complexity of the deformation of the tag lines.
7.
CONCLUSIONS
Our 4D NURBS model is capable of producing comprehensive myocardial
strain calculations for assessing local myocardial contraction in both the left and
right ventricles by reconstructing 3D deformations fields based on available tag
and contour information. The contribution of this research includes the extension
of the model basis from uniform nonrational B-splines to NURBS, the compar-
ison Cartesian-based NURBS models with a cylindrical and prolate spheroidal
parameter assignment with their non-Cartesian counterparts, and construction of
a biventricular model based on the short- and long-axis contours at end-diastole.
These four model types were not meant to exhaust all possible combinations of pa-
rameter assignment and coordinate system, for one could certainly imagine other
plausible combinations. However, considering the shape of the left ventricle, the