Biomedical Engineering Reference
In-Depth Information
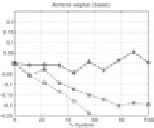
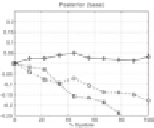
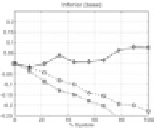
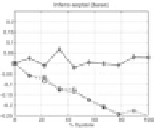
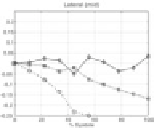
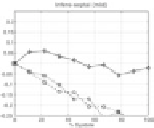
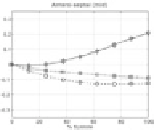
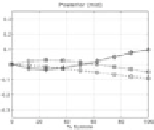
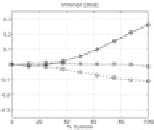
Figure 29.
Average Eulerian normal strain plots for the twelve basal and mid-cavity regions
of the left ventricle of a normal human volunteer. The different geometric shapes (diamond,
circle, and square) represent the radial, circumferential, and longitudinal strain values,
respectively. The
x
axis marks the time point during systole.
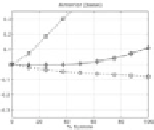
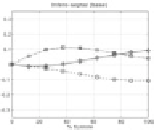
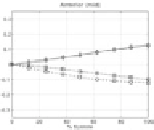
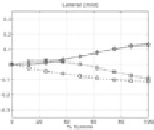
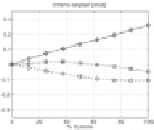
Figure 30.
Average Lagrangian normal strain plots for the twelve basal and mid-cavity
regions of the left ventricle of a patient with a history of myocardial infarction. The different
geometric shapes (diamond, circle, and square) represent the radial, circumferential, and
longitudinal strain values, respectively. The
x
axis marks the time point during systole.