Biomedical Engineering Reference
In-Depth Information
10
8
6
4
2
0.05
0.06
0.07
0.08
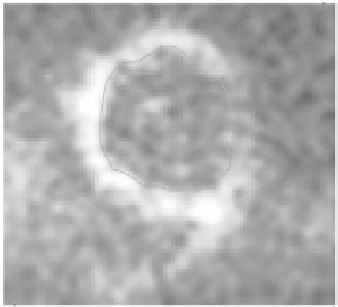
Figure 24.
Plot of accumulated level sets in slice
k
= 130
(left); the histogram of the
segmentation function in this slice (right). See attached CD for color version.
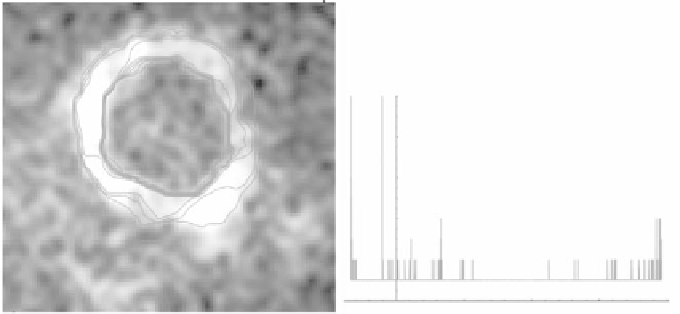
Figure 25.
Plot of image intensity together with level line 0.052 in slices
k
= 130
(left)
and
k
= 125
(right). Visualization of 3D surface in Figure 22 is done with the same level
set. See attached CD for color version.