Biomedical Engineering Reference
In-Depth Information
Figure 22.
Volume rendering of the original 3D data set.
See attached CD for color
version.
0.8
0.6
0.4
0.2
80
60
40
20
40
20
60
80
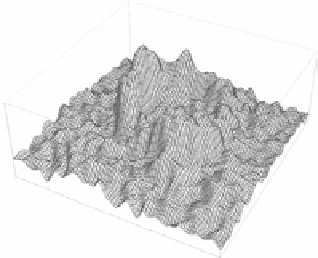
Figure 23.
Plot of image intensity in slice
k
= 130
(left), and its 3D graphical view (right).
See attached CD for color version.