Biomedical Engineering Reference
In-Depth Information
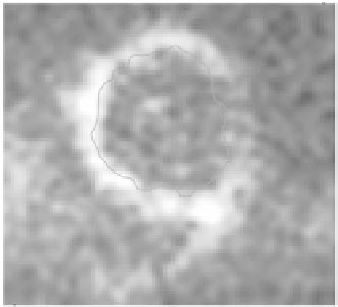
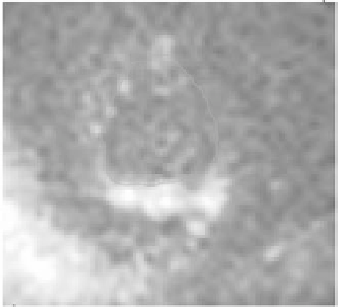
Figure 26.
Plot of image intensity together with level line 0.052 in slices
k
= 115
(left)
and
k
= 100
(right). Visualization of 3D surface in Figure 22 is done with the same level
set. See attached CD for color version.
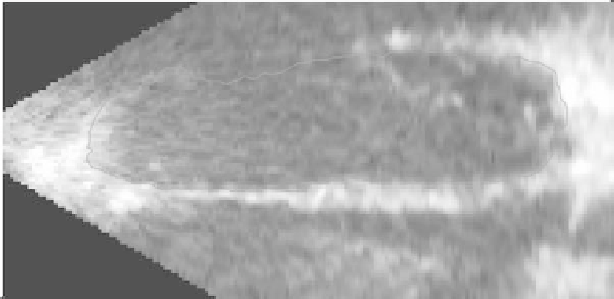
Figure 27.
Plot of image intensity together with level line 0.052 in two other slices,
j
=40
.
Visualization of 3D surface in Figure 22 is done with the same level set. See attached CD
for color version.