Environmental Engineering Reference
In-Depth Information
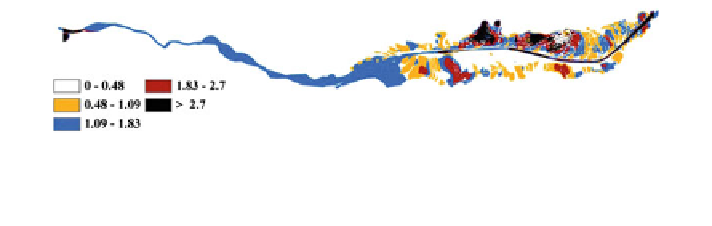
Fig. 6.51 Scenario (4); simulation of velocity (m/s), (food 1957 for the profile of 2008, with the
assumption of dyke break)
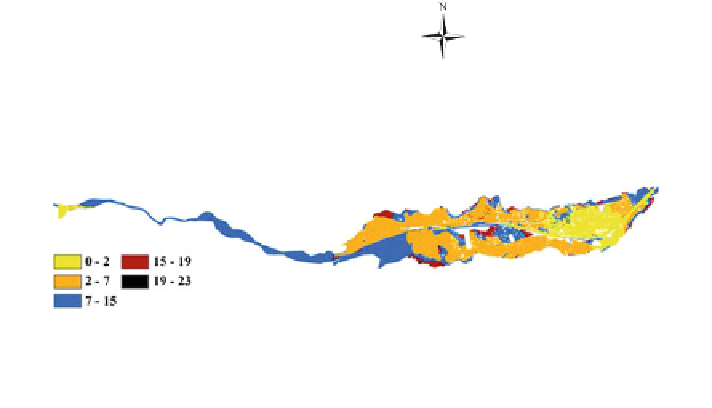
Fig. 6.52 Scenario (4); simulation of depth of water (m), (food 1957 for the dyke profile of
2008, with the assumption of dyke break)
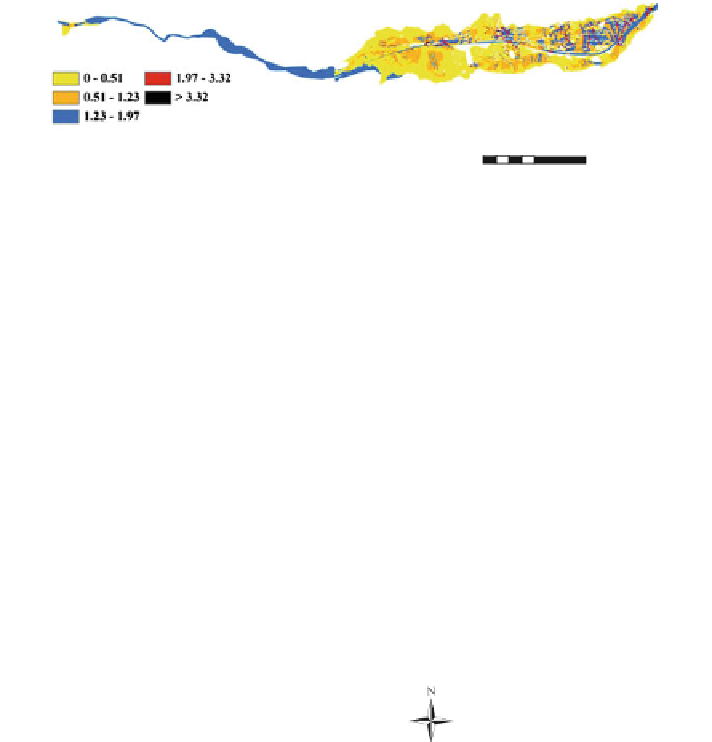
Fig. 6.53 Scenario (4); simulation of duration (h), (food 1957 for the dyke profile of 2008, with
the assumption of dyke break)
Figure
6.55
shows the critical depth in Ubaye River profile from upstream to
downstream: (a) simulation with maximum discharge of 205 m
3
/s and (b) simu-
lation with maximum discharge of 480 m
3
/s. As shown in the figures, the critical
depth for both models shows almost the same location for upstream and down-
stream. It means that in these locations, the banks have the capacity to overtop.
Figure
6.56
shows the simulation of velocity and water depth in Ubaye River.
Dash lines represent simulations with a maximum discharge of 205 m
3
/s and solid


Search WWH ::

Custom Search