Environmental Engineering Reference
In-Depth Information
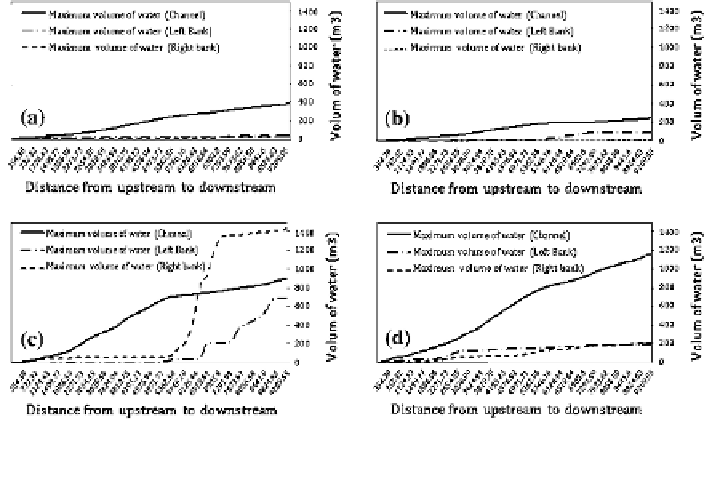
Fig. 6.54 a Scenario (1) volume of water. b Scenario (2) volume of water. c Scenario (3) volume
of water. d Scenario (4) volume of water
lines represent simulations with a maximum discharge of 480 m
3
/s. Upstream is on
the left of the graph and downstream is on the right of the graph.
In the results, modeling the maximum flood—inundated—area is delineated in
relation to the four cases. Time, elevation, and peak are determined when the flow
starts to overtop at one cross section in the upstream and at another cross section in
the downstream. Figure
6.57
shows the start of overtopping for upstream and
downstream of the Ubaye River in all four scenarios.
Figures
6.58
-
6.61
represent shear stress (N/m
2
) in different scenario simula-
tions which is the force of moving water against the bed of the channel. Gray
indicates the critical location to Shear stress.
Search WWH ::

Custom Search