Environmental Engineering Reference
In-Depth Information
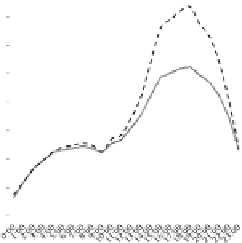
500
Up stream
Stage
Flow
1148.3
1147.9
400
1147.5
300
1147.1
1146.7
200
1146.3
100
1145.9
The area between cross sections 11&12
1145.5
0
Time
Fig. 6.49
Stage, elevation, flow hydrograph, and time of inundation at cross sections between 11
and 12
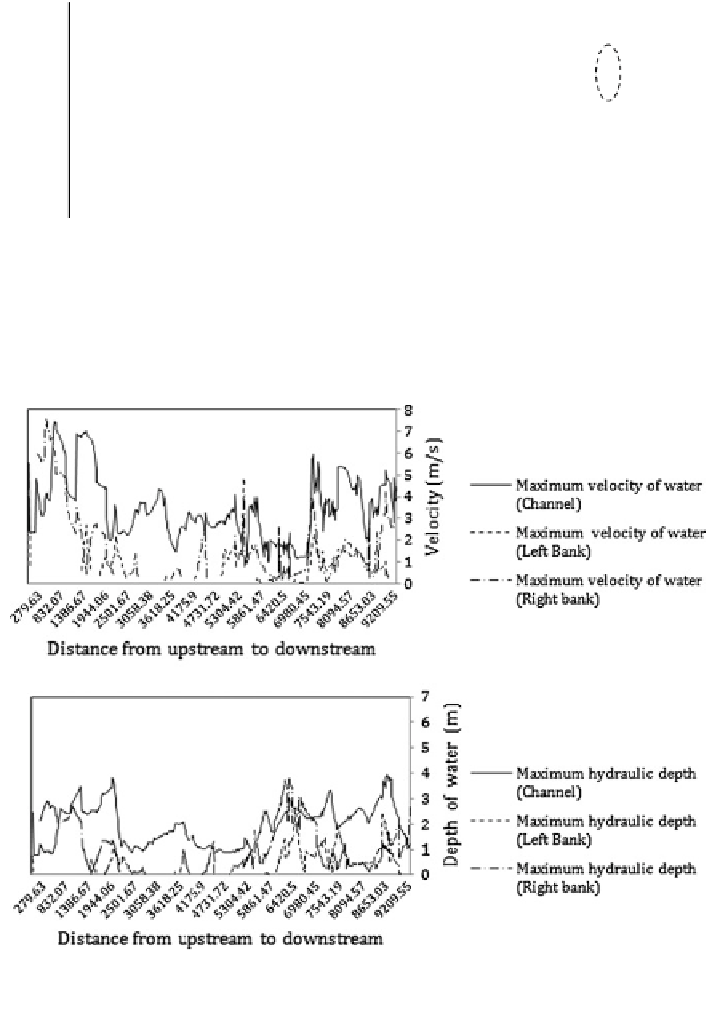
Fig. 6.50 Scenario (4); estimated velocity (m/s) and depth of water (m), food 1957 for the profile
of 2008; (modeling with considering the dyke)


Search WWH ::

Custom Search