Hardware Reference
In-Depth Information
−110
−120
−130
−140
−150
−160
10
0
10
1
10
2
10
3
10
4
10
5
10
6
150
100
50
0
−50
10
0
10
1
10
2
10
3
10
4
10
5
10
6
Frequency (rad/s)
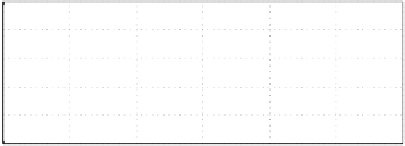
Figure 3.9: The Bode plot of the controller corresponding to Figure 3.8. Solid
line: no resonance. Dashed-line: with resonance compensator.
0
−20
−40
−60
−80
10
0
10
1
10
2
10
3
10
4
10
5
10
6
200
100
0
−100
10
0
10
1
10
2
10
3
10
4
10
5
10
6
Frequency (rad/s)
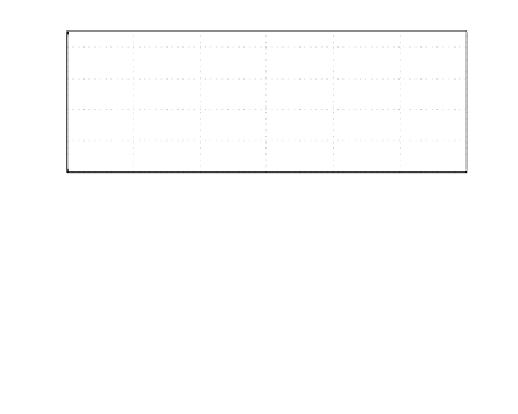
Figure 3.10: Sensitivity transfer function and complementary sensitivity trans-
fer function corresponding to Figure 3.8. Solid line: no resonance. Dashed-line:
with resonance compensator.