Biology Reference
In-Depth Information
It is significant that the noise distributions of both the DNA microar-
ray and MPSS data can be rescaled to expression level independent
functional forms, as this demonstrates the general applicability of
this methodology of noise analysis to global gene expression assays.
It is noteworthy that both of these distributions can be described by
the same functional form.
The noise distribution plotted in figure 4.11c can be used to formu-
late the null hypothesis testing whether a difference in expression in a
binary comparison is beyond measurement error. Given a positive
value of dq¢, say dq¢
0
, the area under the distribution of figure 4.10c for
is the
p
-value corresponding to a normalized differential
expression of magnitude dq¢
0
.
dq
′ >
δ
q
′
0
Likewise, for a chosen
p
-value, one can
find a corresponding dq¢
0
.
Put differently, given the function
Φ
(dq
′
), one
may define the function
P
(|)
dq q
0
using eq. (2) and from this function
compute a
p
-value from eq. (5).
For example, a
p
-value of 0.05 corresponds to a dq¢
0
of 2.13. That is,
all points with |dq|
) will have a
p
-value less than 0.05.
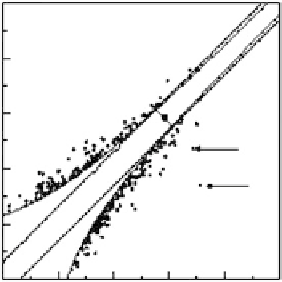
These points are plotted in figure 4.12, along with the two delimiting
curves corresponding to the equation |dq¢| = 2.13s (q
>
2.13s (q
0
). If the parame-
terization of the distribution is correct, then the fraction of points
outside of those curves should be close to 0.05. Indeed, it is 0.04.
The one-zero null hypothesis (case 2) is formulated in a manner
similar to the nonzero hypothesis. That is, one begins by plotting
(figure 4.13a) all replicate points (q
i,j
,q
i,j
′
0
) where
j
and
j
' are biological
replicates taken at
t
4 h. However, in this instance
only those signatures
i
for which at least one of the pair of biological
replicates is composed of one zero and one nonzero sequencing
replicate are considered. The variation between replicates in this data
is significantly greater than that observed for the nonzero data.
=
0 as well as at
t
=
Figure 4.12
Illustration of data
in region of significance for figure
4.11(a) and
p
-value equal to 0.05.
The two straight lines represent
2-fold expression changes.


Search WWH ::

Custom Search