Biology Reference
In-Depth Information
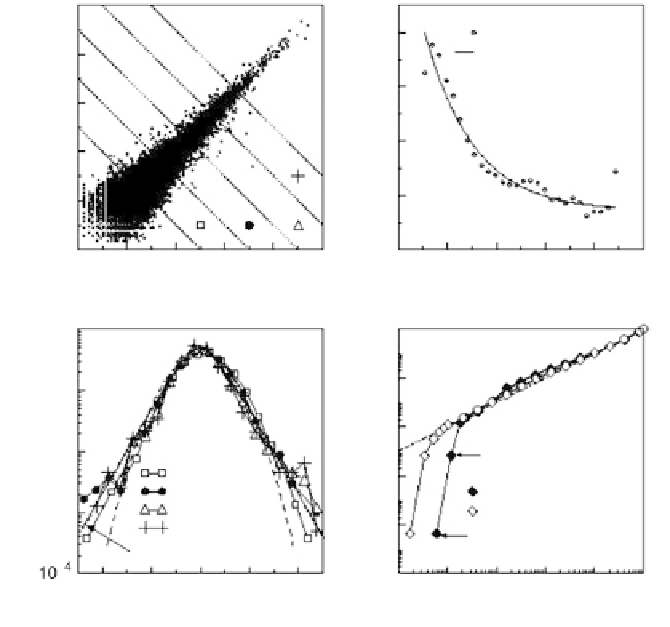
Figure 4.11
(a) Scatter plot of signature log
10
-tpm pairs (q
i
,
j
,q
i,j
′
), where
replicates
j
and
j'
are biological replicates taken at
t
0 (i.e., each q is the log of
an aggregate tpm derived from two biological replicates) for all signatures
i
that have nonzero tpm counts in all four sequence replicates. Also plotted are
equivalent points for which
j
and
j'
are biological replicates taken at
t
=
4 h.
(b) Standard deviation of measurement noise s as a function of signal level q
for data shown in (a). Solid line is best fit of calculated values of s to an
exponential decay function. (c) Conditional probability density function
P
(dq
'|
q
=
)
as a function of the rescaled noise dq
'
K
dq/s for ranges of signal level
1.25
).
Note that following normalization these distributions are independent of
signal level. Fits to the data are discussed in the text. (d)
p
-value as a function
of the fraction of significant data for measurements to which the nonzero null
hypothesis is applicable (
<
q
<
1.75
(
), 1.75
<
q
<
2.25
(
•), 2.25
<
q
<
2.75
(∆
), and 2.75
<
q
<
3.25
(+
♦
) as well as for all measurements (
◊
).
the spread away from the diagonal (measured by dq) is independent of the
expression strength, as all the distributions coalesce approximately to
a single curve
). The tails of this curve decrease more slowly than
a Gaussian (dashed line in figure 4.11c), and are well described by
the function
Φ
(dq
′
05
.exp(
−
x
/.
05 06
+
.| )
x
(thick solid line in figure 4.11c).
2


Search WWH ::

Custom Search