Biology Reference
In-Depth Information
Figure 8.1b
Advanced trading interface.
100
Lower than 1%
1% to 2.5%
2.5% to 5.0%
5.0% to 10.0%
Higher than 10.0%
80
60
40
20
0
Date
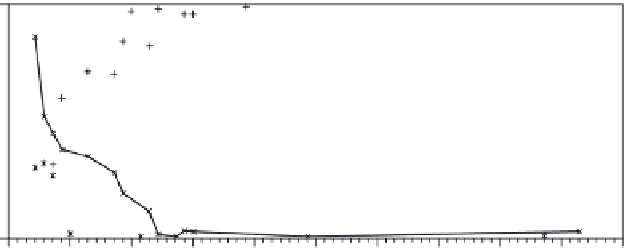
Figure 8.2
Price graph for the contract “What will the mortality rate for novel influenza A (H1N1) be by
the end of July 2009?”