Biomedical Engineering Reference
In-Depth Information
of the denoised slices improved and with a better definition of borders and
more homogeneity inside the white and gray areas. Quantitatively, SNR values
improved by 50% between 3D and 4D denoising.
A second motivation for performing multidimensional analysis on cardiac
clinical data is to take full advantage of the continuity of spatial and temporal
frequency content of multidimensional RT3D signals. The high level of speckle
noise in ultrasound clinical data sets recorded with the real-time 3D transducer,
the nonuniform absorption coefficients of cardiac tissues, and the motion of the
heart contribute to the addition of artifacts that can either add echolike signals
inside the cavity or suppress echo signals from the myocardium wall. These
artifacts complicate the segmentation task by introducing artificial edges inside
the cavity or destroying edges at the epicardial and endocardial borders. Since
these artifacts are not persistent in time, inclusion of the temporal component
in the analysis helps resolve them. To illustrate the aptitude of the brushlet
analysis to provide missing contour information, the previous mathematical
phantom was modified by removing a part of the white wall in the eighth time
frame. Both 3D analysis on the time frame with the defect and 4D brushlet
analysis applied to the 16 time frames were computed after corruption with
Rayleigh speckle noise. Results are displayed in Fig. 6.17.
Results showed a remarkable correction of the wall defect with the 4D
(3D
+
time) brushlet denoising that could not be obtained with 3D analysis alone.
This type of artifact is similar to the dropouts in echo signals that result in loss
of myocardium tissue in some frames or the introduction of tissuelike signals
inside the cavity. Such artifacts are not persistent in time and could be removed
with the inclusion of temporal dimension in the denoising process.
Finally, experiments on clinical data sets, as illustrated in Fig. 6.18, showed
the superior performance of spatio-temporal denoising versus simple spatial
(a)
(b)
(c)
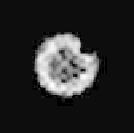
Figure 6.17:
(a) Original noisy slice with defect, (b) denoised slice with 3D
brushlet analysis, and (c) denoised slice with 4D brushlet analysis.