Biomedical Engineering Reference
In-Depth Information
(a)
(b)
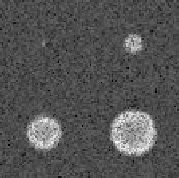
Figure 6.15: Mathematical phantom corrupted with speckle noise. (a) Speckle
noise with uniform distribution. (b) Speckle noise with Rayleigh distribution.
Denoising was carried out with both 3D and 4D brushlet analyses. Regu-
lar tiling was applied with four subintervals in each dimension. Volumes were
reconstructed after resetting the higher frequency coefficients and hard thresh-
olding the lower frequency coefficients at 25% of their maxima. Results for a
single slice are provided in Fig. 6.16.
These results revealed that inclusion of the temporal dimension greatly im-
proved the denoising performance. From a qualitative point of view, the contrast
6.6 db
17 db
-
15 db
(a.1)
(a.2)
(a.3)
-
15 db
7.5 db
16.3 db
(b.1)
(b.2)
(b.3)
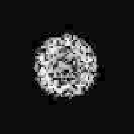
Figure 6.16: Denoising of mathematical phantom with 3D and 4D brushlet anal-
yses. (a) Results for phantom corrupted with uniformly distributed speckle
noise. (b) Results for phantom corrupted with Rayleigh distributed speckle
noise. ((a.1)-(b.1)) Original slices. ((a.2)-(b.2)) Slices denoised with 3D brush-
let expansion. ((a.3)-(b.3)) Slices denoised with 4D brushlet expansion. SNR
values are indicated for each slice.