Database Reference
In-Depth Information
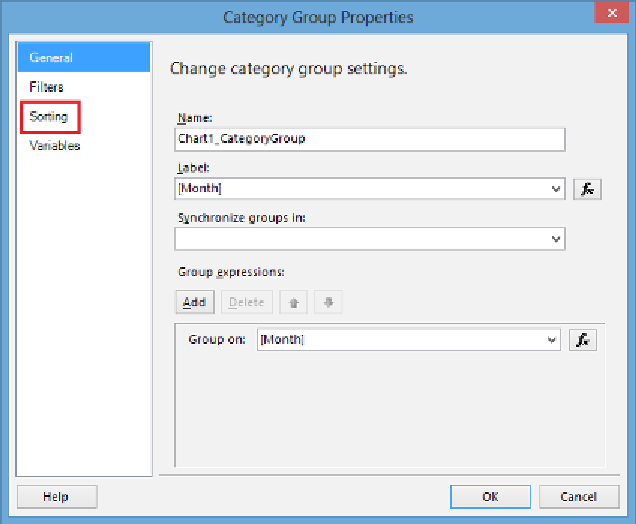
Category Group Properties dialog box
8. Select the
Sorting
tab, change the
Sort by
column from
[Month]
to
[MonthNumberOfYear]
, and click on
OK
. This will keep the months on the
x axis sorted in the correct order; otherwise, they will be sorted alphabetically
and data for August will appear before February, which is incorrect.
9. In the
Series Groups
section of the
Chart Data
configuration box, click on
the green button (shaped like a plus sign), and select the
CalendarYear
data
field from the options listed. This will separate the lines on the chart by year
allowing the business users to compare year-over-year trends.
10. Right-click on the y axis label and uncheck the
Show Axis Title
option to
remove it from the display.
11. Do the same with the x axis label.
12. Click on the chart title and change the title from
Chart Title
to
Year over
Year - Sales Amount
.