Database Reference
In-Depth Information
4.
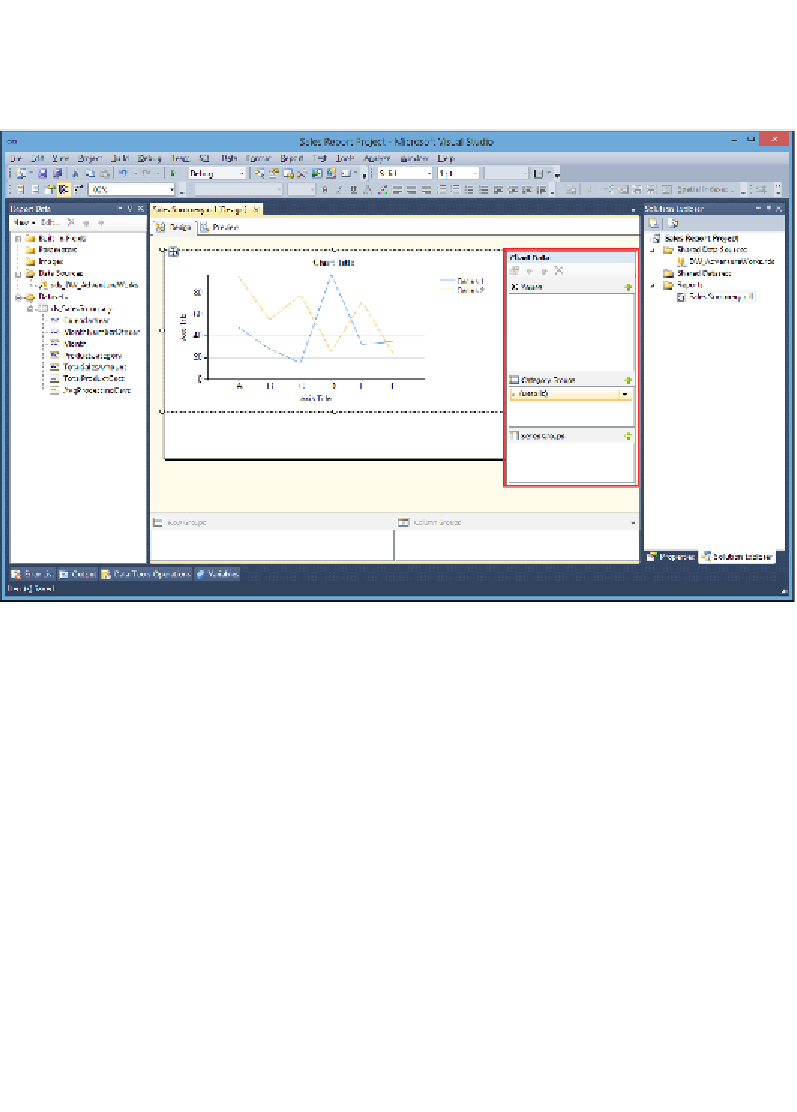
Now, double-click on the chart item that was created on the report canvas;
notice the
Chart Data
configuration box that appears to the right. Most report
items, such as data bars, spark lines, and gauges, have configuration boxes
like the one shown in the following screenshot:
5.
In the
Values
section of the
Chart Data
configuration box, click on the green
button (shaped like a plus sign), and select the
TotalSalesAmount
data field
from the options listed.
6.
In the
Category Groups
section of the
Chart Data
configuration box, click
on the drop-down arrow on the right-side of the
(Details)
item, and select
the
Month
data field.
7.
Click on the same drop-down arrow from the previous step, and select
the
Category Group Properties…
option to bring up the
Category Group
Properties
window as shown in the following screenshot: