Chemistry Reference
In-Depth Information
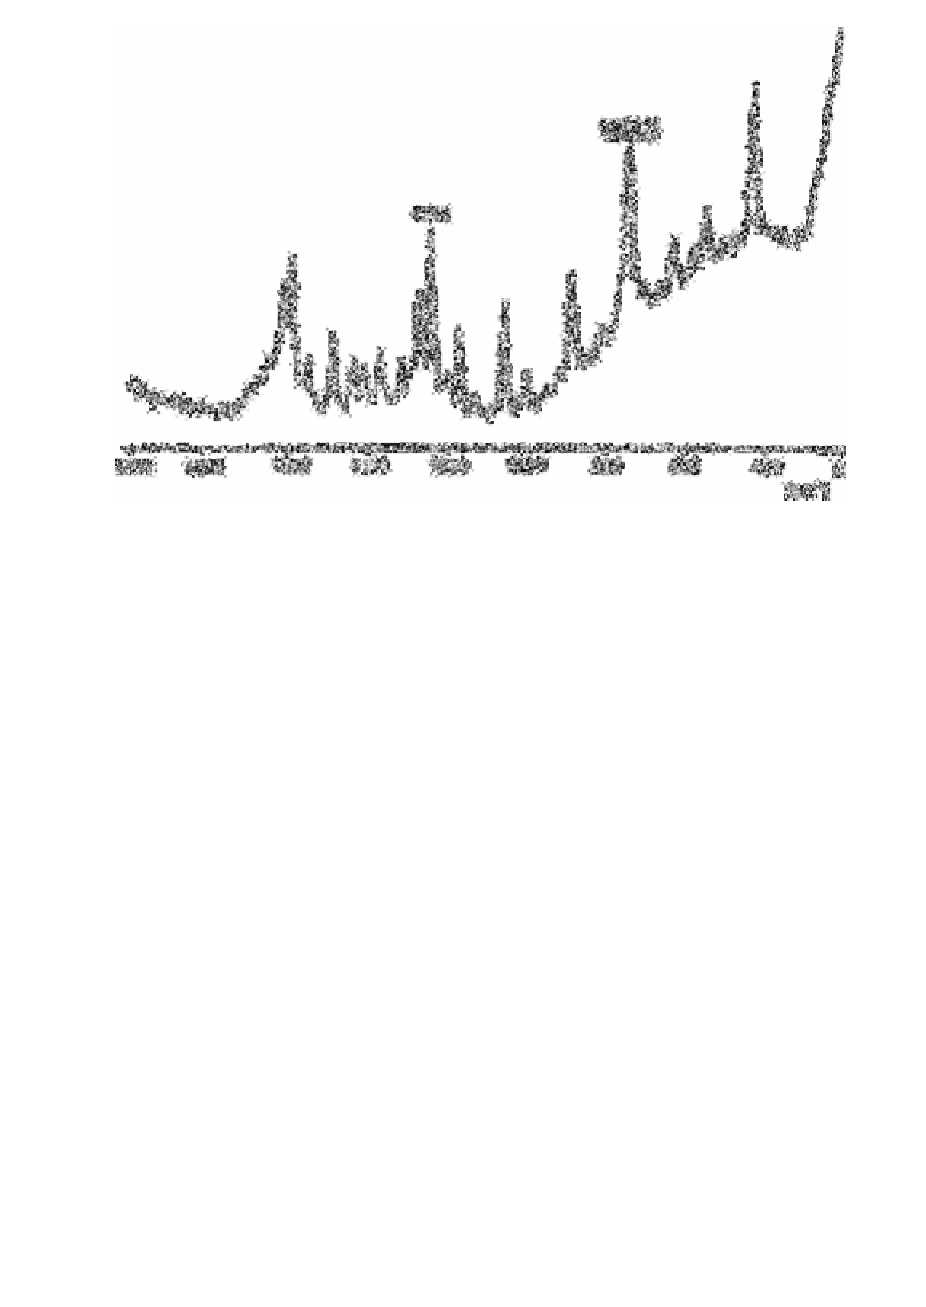
Fig. 8.3
Resonance Raman spectrum of the coloured product. Concentration of
nitrite 0.2mg L
−1
Source: Reproduced with permission from Elsevier Science [71]
Raman spectra were recorded on a JASCO Model J-800 Laser Raman
Spectrophotometer. A Spectra-Physics Model 164 Argon Ion Laser was used as an
exciting source. A HTC 464 photomultiplier was used as a detector. The spectral data
were processed by a data processor containing a microcomputer in conjunction with the
Spectrophotometer. In order to improve the S/N ratios of the spectra, the data were
accumulated and the number of repetitive scans was determined according to the noise
levels for each of the spectra. The sample solutions were illuminated with the 488.0nm
line at 200mW output. In order to minimise the effect of local heating of samples due to
the laser beam irradiation and the possible decomposition of the coloured product, the
sample cell was rotated using a JASCO Model R-10 Cell Rotator (2500 rpm
−1
).
Moreover, the sample solutions were irradiated very close to the cell wall to minimise the
reabsorption of scattering lights.
I
n this method a portion of the sample containing up to 7µg L
−1
nitrite is diluted with
water and treated with acidic sulphanilic acid and acidic a-naphthylamine then the pH
adjusted to 2-2.5 with 28% sodium acetate solution.
The coloured product obtained has a broad adsorption band with the maximum
absorption at 520nm The coloured product
exhibits the resonance Raman effect against the 488.0nm line of argon ion laser. In Fig.
8.3 the resonance Raman spectrum

Search WWH ::

Custom Search