Chemistry Reference
In-Depth Information
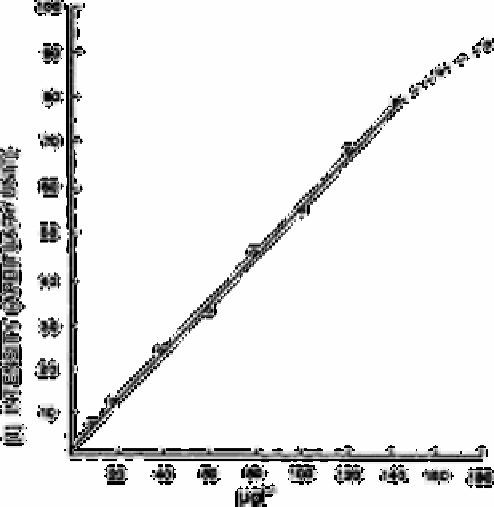
Fig. 8.4
Analytical curve obtained for the aqueous solutions of NO
2
−
in the
concentration range from 10 to 180mg L
−1
. The empirical formula
was determined by the least squares method: 1=1.45+0.55, C,
Sc=2.70µg L
−1
(for the concentration)
Source: Reproduced with permission from Elsevier Science [71]
of this product solution is shown. The concentration of the solution is 0.2mg L
−1
(4×10
−6
mol L
−1
). As is seen from this figure, the solution of the azo dye obtained gives a
lot of bands in the 2000-200cm
−1
region in spite of remarkably low concentration. Of
these bands, the one at 1250 cm
−1
was used as a key band corresponding to nitrite since
the band has the maximum peak intensity, and the background intensity in the vicinity of
this band is comparatively low.
The sample solutions produced by the above mentioned reaction exhibit a
comparatively strong background, which probably comes mainly from the fluorescence
due to the laser beam irradiation, and, because of this, the required sensitivity cannot be
attained unless this background intensity is made considerably lower by the addition of
an inorganic salt as a quencher of fluorescence.
The addition of sodium thiocyanate leads to a marked decrease of the background.
Moreover, it is seen that no distinct change of the reduced background is observed in this
case, which means that the reduction rapidly reaches the equilibrium state.
In Fig. 8.4 the analytical curve obtained for aqueous solutions of nitrite in the
concentration range 10-180µg L
−1
is shown. The curve can be fitted to a straight line in
the concentration range below 140µg L
−1
. When the concentrations of the added nitrite
are smaller, that is, from 0 to 10µg L
−1
the relation obtained is also linear in this range.

Search WWH ::

Custom Search