Chemistry Reference
In-Depth Information
kept
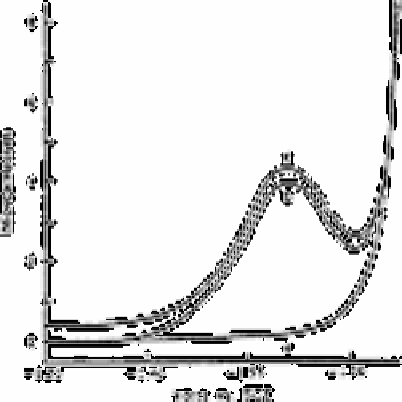
Fig. 3.2
Differential pulse polarographic verification of sunlight-induced
bromate production in chlorinated seawater. Curve (a) polarogram
from untreated seawater, seawater immediately after chlorination to
4.9ppm, or chlorinated seawater kept in the dark for 4h at 40°C.
Curve (b) polarogram from chlorinated seawater exposed to full
sunlight for 70min. Curve (c) standard: 1.0×10
−6
M sodium bromate
in seawater, offset with respect to curves (a) and (b). Polarograms
were recorded at 25°C and pH 8.35; SCE, saturated calomel electrode
Source: Reproduced with permission from Springer-Verlag [18]
in the dark for 24h at 40°C It would appear that large amounts of bromate have already
been produced in estuarine and coastal waters with unknown effects, as little information
is available on the direct toxicity of the bromate ion.
Details of the chlorination experiment referred to above are now discussed in more
detail.
After chlorination, beakers were removed from the sunlight at regular (usually 30min)
intervals, placed in a dark box, and analysed for bromate and residual oxidants without
delay. Residual oxidants analyses were performed by the I
3
−
spectrophotometric titration
procedure described by Carpenter [18] with a pH of 2 and a potassium iodide
concentration of 4gL
−1
. Bromate analyses were made by differential pulse polarography
at 25°C and a pH of 8.35 (after oxygen stripping with nitrogen), using a Princeton
Applied Research model 174A polarographic analyser.
A typical polarographic recording is shown in Fig. 3.2 curve (a) is the polarogram
obtained for chlorinated seawater analysed immediately after chlorination. Identical
traces were observed for non-chlorinated seawater and for chlorinated seawater kept in
the dark for periods up to 24h at temperatures up to 40°C, which indicates a lack of
bromate formation under these conditions (
less than 0.5%

Search WWH ::

Custom Search