Chemistry Reference
In-Depth Information
complex matrices such as polyphosphates and phosphoesters.
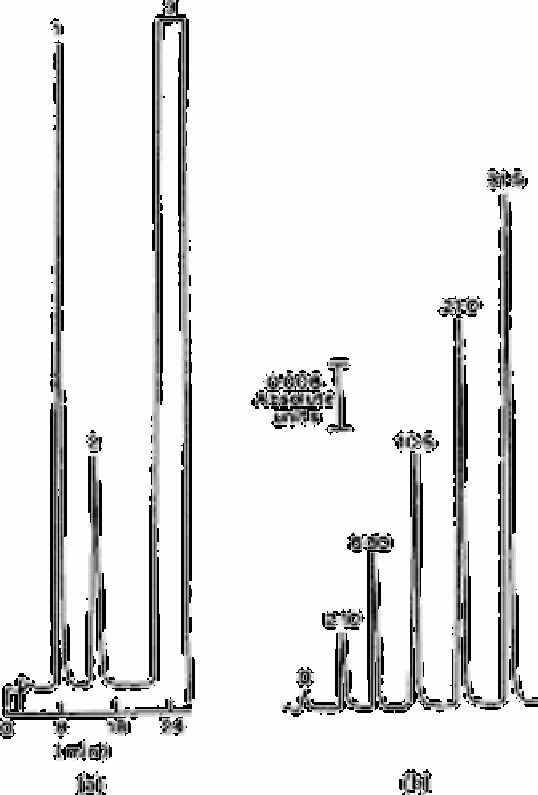
Fig. 2.43 shows a typical chromatogram for a standard 42µg L
−1
phosphate solution
and hypoxanthine peaks resulting from various
Fig. 2.43
(a) Sample chromatogram of a 42mg L
−1
phosphate
sample.Absorbance units full scale, su.f.s.=0.08. Peaks:
1=hypoxanthine; 2=m-aminophenol; 3=inosine. (b) Hypoxanthine
peak for various phosphate concentrations in mg L
−1
(indicated
above each peak)
Source: Reproduced with permission from Springer Verlag [651]
phosphate samples after reaction with the enzyme. The calibration curve had a slope of
0.043±0.002 and an intercept of 0.124±0.033 with a correl-ation coefficient of 0.998.
Search WWH ::

Custom Search