Chemistry Reference
In-Depth Information
Linearity up to 30mg L
−1
was observed. Relative standard deviation of triplicate runs was
10% or less. The detection limit, twice the signal of the blank, was determined to be
1.5mg L
−1
.
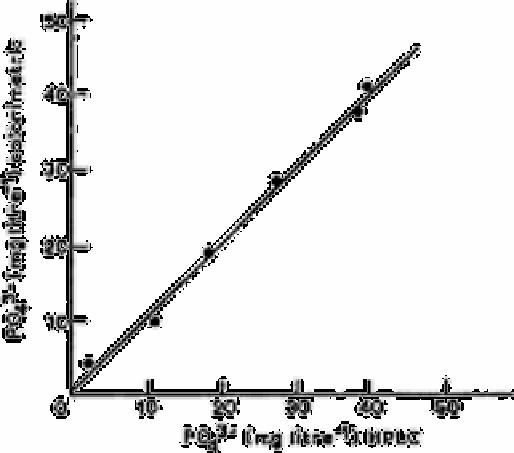
Fig. 2.44 is a plot of phosphate concentration given by the enzymatic method vs that
found by the molybdate blue method. The line fit to these points had a slope of
0.999±0.046 and an intercept of 0.421±1.222 with a correlation coefficient of 0.996.
Fig. 2.44
Concentration of phosphate obtained by the colorimetric method
versus the concentration obtained by the enzymatic high performance
liquid chromatographic method
Source: Reproduced with permission from Springer Verlag [651]
To compare the selectivity of the enzymatic method with that of the molybdate blue
method, interference studies were conducted for both methods. The first study was the
effect of tripolyphosphate in the sample. The molybdate blue method showed a positive
deviation with increasing amounts of tripolyphosphate. The reason for this positive
deviation can be attributed to the acid hydrolysis of tripolyphosphate to orthophosphate.
The enzymatic method also showed a slight positive deviation probably due to
orthophosphate impurity in the triphosphate used.
2.75.12
Ion exclusion chromatography
The application of this technique is discussed under multianion analysis in section
13.2.1.3.
Search WWH ::

Custom Search