Database Reference
In-Depth Information
Figure 9-24.
Blocking session for a Session Details General page
The Statistics tab displays all statistical information regarding the session, physical and logical waits, detailed
CPU usage information, gets, and buffer information. Table
9-1
shows detailed Statistics tab information.
Table 9-1.
Detailed Information on the Statistics Tab from the Session Details Page
Name
Delta
Current
Rate
Logical read bytes from cache
7059480576
2.23292E+12
1203662464
Index fetch by key
2133336
461521952
363740
Session logical reads
861753
272791968
146931
Consistent gets
861753
272791936
146931
Consistent gets from cache
861753
272573472
146931
Consistent gets-examination
719763
184395184
122721
Buffer is pinned count
617903
245734928
105354
The Statistics tab contains no drill-downs or links, but it does offer the opportunity to enable tracing to collect
deeper session-level data or to kill the session.
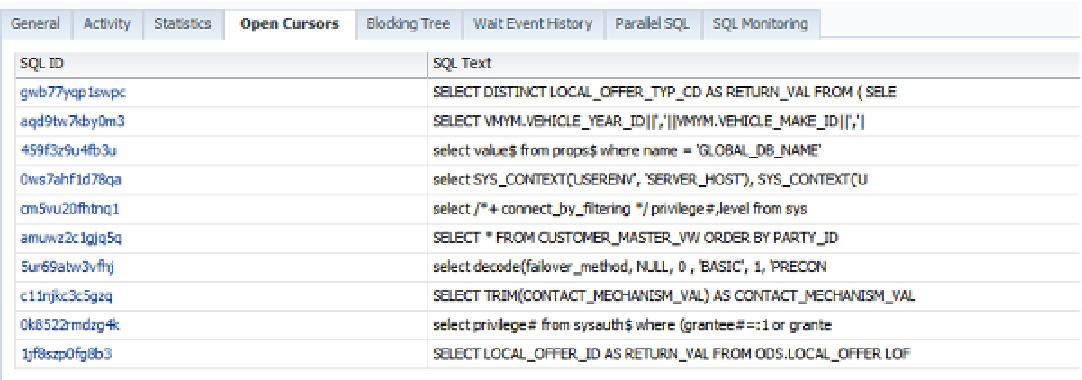
The Open Cursors tab, shown in Figure
9-25
, is extremely helpful in identifying cursor- or mutex-level performance
issues in a session. The pane quickly displays the cursor and count, led by the SQL ID, which will again link to the SQL
Details page to identify any issues in the cursor SQL.
Figure 9-25.
Open cursors for ongoing processes from the Session Details page