Database Reference
In-Depth Information
The session ID and username are displayed prominently in the upper-left corner. The options to either trace or
kill the session are, again, available at the upper-right and lower-right corners.
The Blocking tab displays information about any blocking sessions that may be active in the environment.
Because of the complexity of blocking information, this tab can take an extended time to display, but the data found in
the pane is quite valuable.
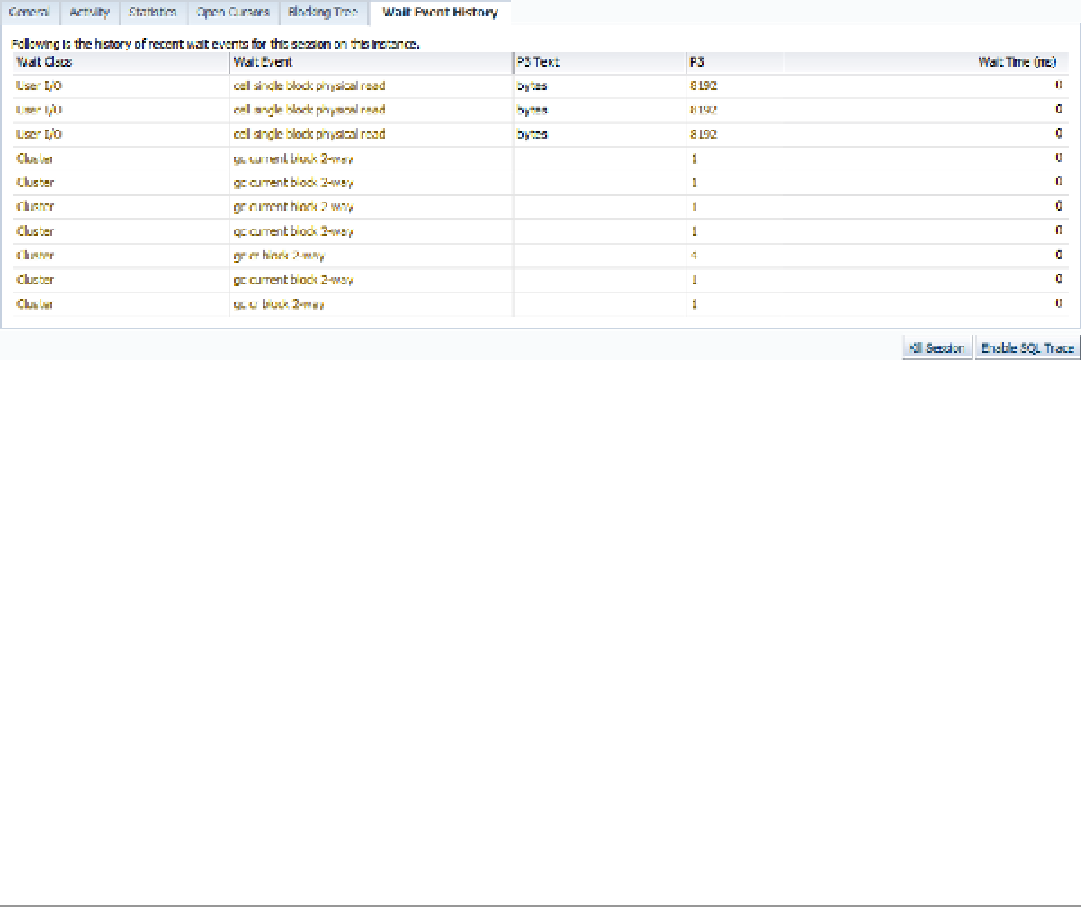
The Wait Event History tab, shown in Figure
9-26
, displays the wait event information, with the most recent wait
event at the top. Displayed are the wait class, the actual wait event, and the P1, P2, and P3 text, all linking to detailed
data about the wait information (data resulting from
dba_hist_active_sess_history
). The option to trace or kill the
session is again offered at the top and bottom of the right-hand side.
Figure 9-26.
Wait information from the Session Details page's Wait Event History tab
The Parallel SQL tab shows data regarding any parallel execution information the session is involved in—including
whether the session belongs to the coordinator or a slave, and if a slave, the producer or consumer of the parallel process.
The SQL Monitoring tab is available only for Oracle Database versions 11g Release 1 for the command-line data,
and 11g Release 2 for the HTML version of the reports. This tab appears grayed out in environments that do not have
this feature set up or available.
The Top Activity area of the performance pages in the EM12c console has a user-friendly interface for the
seasoned administrator with previous Enterprise Manager experience and new, detailed information to assist with
session and SQL performance issues.
ASH Analytics
Analyzing performance across multiple dimensions is a capability that administrators have searched for in the
Enterprise Manager Top Activity graphs without success. ASH Analytics was introduced to offer Active Session History
data in a visual format that previously wasn't offered. The feature offers recursive drill-downs, stacked chart or tree
map views, and the ability to incorporate the current report data into a collaborative view with other ASH reporting.
■
ash analytics is not installed by default. the
ASH_VIEWER
package must be installed to use the ash analytics
view. the database must be an 11g version or higher. an installation will be successful on many 10g instances, but no
data will be displayed on the screen, as the required active session history will not be available to fulfill the graphs.
Note