Database Reference
In-Depth Information
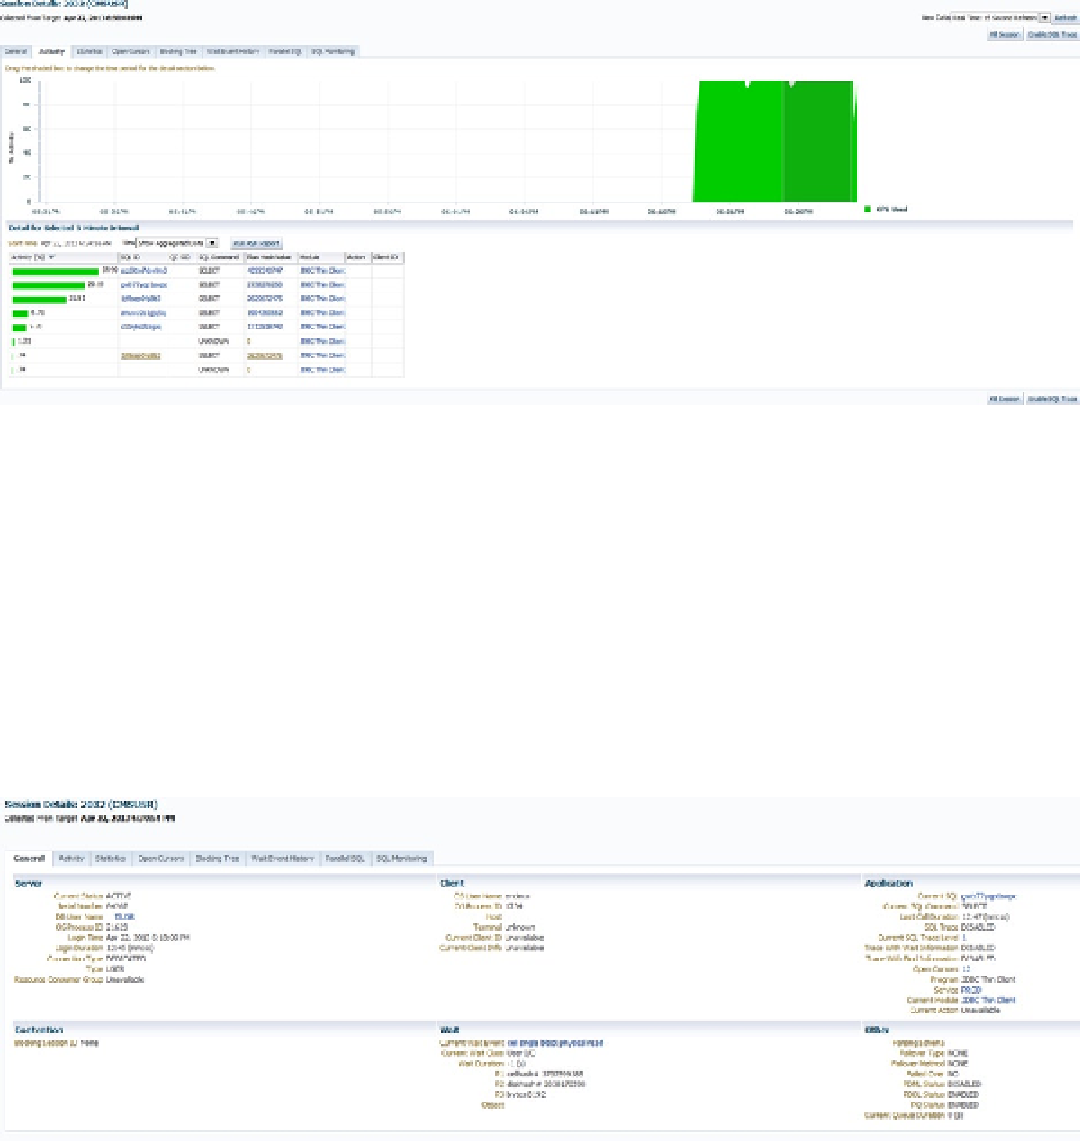
Figure 9-22.
Session Details page, showing an active query execution by SID
The Activity tab shows the wait activity of the session, by color, along with the type of wait in a legend to the
right side of the graph. From the right-hand corner of the page, you can enable tracing or kill the session, along with
changing the refresh interval of the graph. At the bottom of the page is information regarding the 5-minute interval,
highlighted in gray within the graph timeline, along with the SQL ID, which links to the SQL Details page for the
statement executing during the timeline highlighted, along with the plan hash value and module information. If more
than one statement is executed during the 5-minute window, all SQL IDs will be displayed in the detailed section for
the interval.
The General tab, shown in Figure
9-23
, displays all information regarding the session from the Top Activity
page. The Session Details page, as with the SQL Details page, can be reached numerous ways from within the EM12c
console, providing quick access from performance pages to the console to provide data about specific sessions.
Figure 9-23.
General information in the Session Details page
The Session Details page, shown in Figure
9-24
, displays the server-level information, including the OS process
ID (PID), the client information, the application, any blocking that has occurred, and waits. Another section includes
parallel execution information.