Biomedical Engineering Reference
In-Depth Information
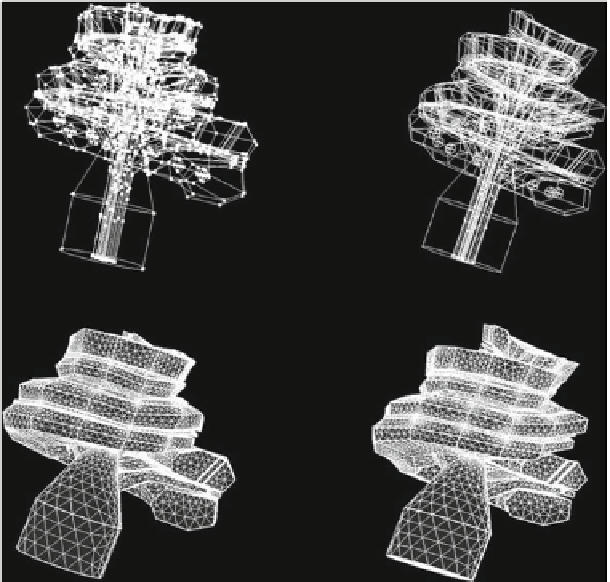
(b)
(a)
(c)
(d)
Fig. 3
Computed Aided Design (CAD) models and generated meshes adapted to the cochlear
dimensions of two patients based on clinical CT images. Figures on the left correspond to the
cochlea “C1” and figures on the right correspond to the cochlea “C2”
The cochlear geometry was discretized into elements with a minimum size of
0.2mm leading to a total of 485654 and 441389 elements for the cochlea “C1” and
“C2” respectively (Fig.
3
c, d).
Along the CAD model of the cochlea, measurements of the electrical field were
performed at the electrode positions, and at different positions of the spiral gan-
glions. Each spiral ganglion was modeled by 10 nodes (Fig.
4
a). In total 3,000 spiral
ganglions positions were modelled covering two and half turns of the cochlea as
presented in Fig.
4
.
2.2 Materials
The geometry was classified into domains, and each domain was assigned a material
property in the form of conductivity. The conductivity values are listed in Table
2
.